


193
FIS Viewer
1. If you wish to modify the number of maximum values displayed, click the
Number of maximum values
radio button in the
Highest peaks
box.
2. Check the
Mark peaks
checkbox to display the corresponding maximum
values in the diagram.
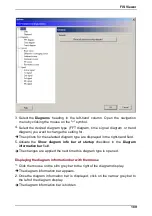
Displaying the measured values of harmonics
If the
Harmonic cursor
is selected, this diagram information area is displayed.
The table shows the measured values that most closely correspond to the
harmonic.
The
Harmonics
table displays the measured values for each harmonics value
calculated.
Modifying the settings for the harmonic cursor
You can modify the settings used to calculate the harmonics via the harmonic
cursor properties.
1. To modify the settings click on the
Cursor properties
symbol in the "Navigation