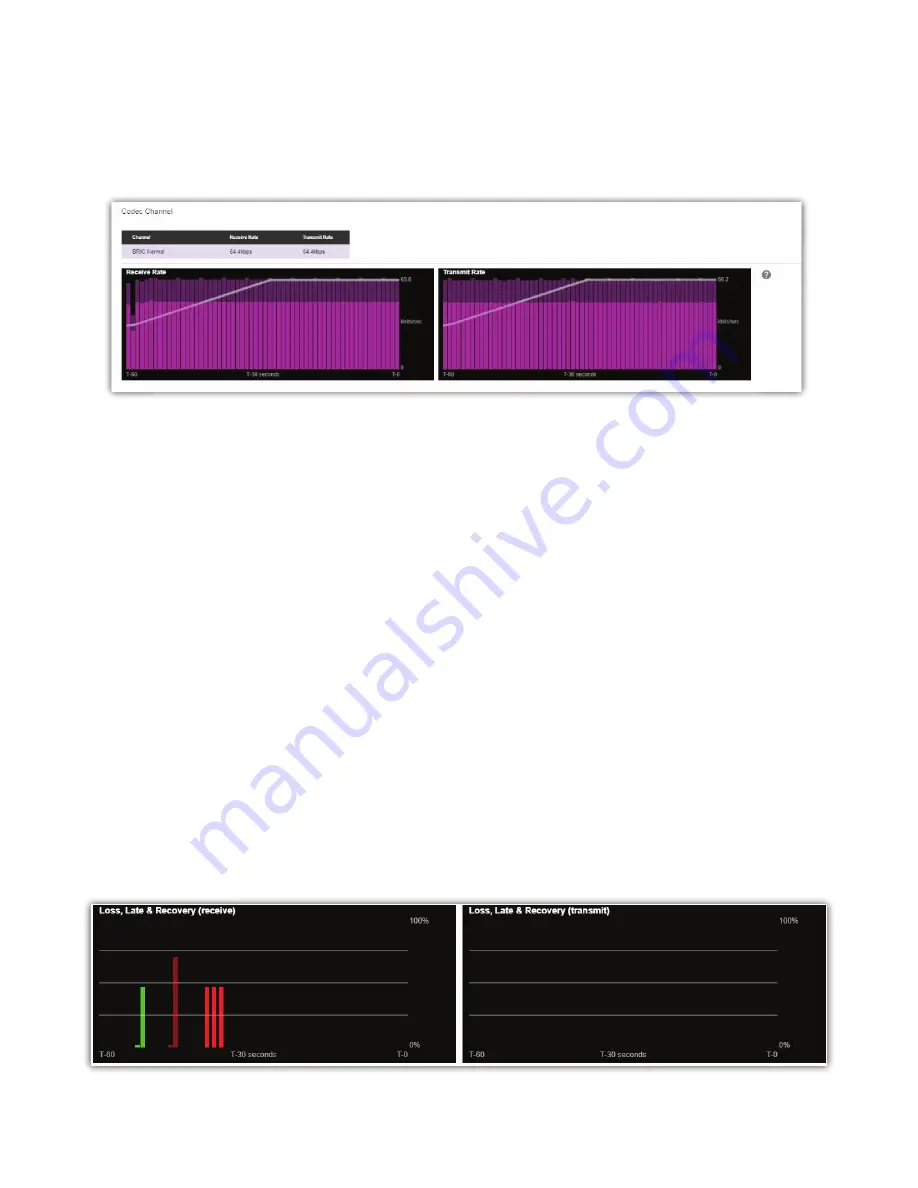
CODEC CHANNEL FIELD
Clicking on the “Codec Channel” header delivers informa on on the BRIC-Link II’s total receive rate and transmit rate
(
Figure 19
), including informa on for mul ple connec ons when applicable. When mul ple transmit connec ons are
ac ve, this will show an aggregate rate of all outgoing connec ons.
CROSSLOCK FIELD
Clicking on the “CrossLock” header opens a set of real- me graphs which monitor the status of the op onal
CrossLock reliability layer. These
fi
elds will not appear when non-CrossLock connec ons are ac ve. These stats are
a powerful tool for monitoring and diagnosing the quality of connec ons, as well as for managing the delay se ngs
during the connec on.
The CrossLock Stats are similar to the informa on available on the Ac ve Connec ons graph; however, the
CrossLock Stats show
fi
ner details about network performance in both direc ons. CrossLock stats are shown for
both the data being transmi ed from the local codec and the data being received by the local codec. All relevant
stats are available for both direc ons.
PACKET LOSS GRAPH
The Packet Loss Graph (as seen in
Figure 20
) indicates, in percentage terms, what’s gone wrong on the network
during each one-second window. Three di
ff
erent color-coded entries appear here: 1.
Packet Loss (dark red)
- The
system has detected a packet has been completely dropped by the network and was never received by the decoder.
2.
Packet Late (bright red)
- The system received the packet, but it was too late for decoding and play out. 3.
Packet
Recovered (green)
- The packet was either lost or late, but was recovered by either the Forward Error Correc on
(FEC) or the Automa c Repeat Query (ARQ) error correc on built into CrossLock.
Summary of Contents for BRIC-Link II
Page 1: ...Product Manual ...
Page 2: ...BRIC Link II June 2021 ...
Page 3: ... ...
Page 4: ... ...
Page 5: ... ...
Page 6: ... ...
Page 7: ... ...
Page 8: ... ...


