129
Auxiliary functions
Type 8792, 8793 REV.2
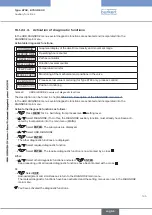
16.1.24.5. Description of the diagnostic functions
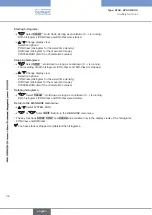
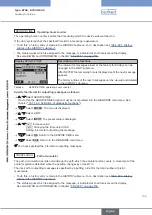
HISTOGRAM
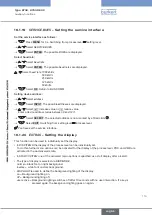
– Output of histograms
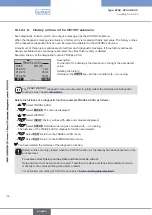
The
HISTOGRAM
menu is divided into 2 parts:
1.
Outputting the histograms for
POS-Class
(dwell time density) and
DIR-Class
(movement range)
2.
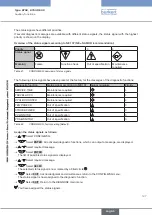
List of the characteristic values
for
CMD Set-point position valve actuator
POS Actual position valve actuator
DEV Deviation from POS to CMD
TEMP Temperature
SP Process set-point value
PV Process actual value
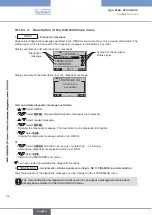
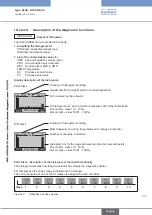
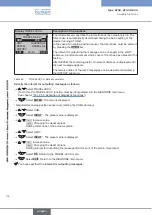
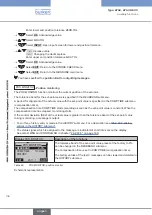
Display description of the histograms:
STOP
CLEAR
POS–Class
00
:
13
:
48
233 c
M
44
Duration of histogram recording
Largest dwell time density which occurred (tallest bar)
Path covered by the actuator
10 histogram bars, each of which represents 10% of the total stroke:
Bar on left = class 1 (0 - 10%)
Bar on right = class 10 (91 - 100%)
POS-Class
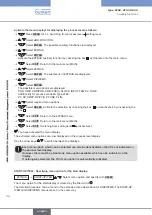
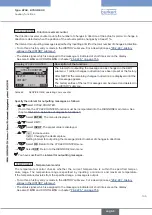
STOP
CLEAR
DIR–Class
00
:
13
:
48
72
50
Duration of histogram recording
Most frequently occurring range between 2 changes in direction
Number of changes in direction
Histogram bar for the range between two direction reversal points
Bar on left = class 1 (0 - 10%)
Bar on right = class 10 (91 - 100%)
DIR-Class
POS-Class -
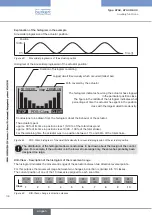
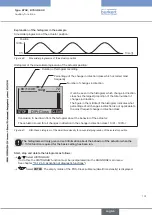
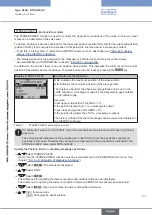
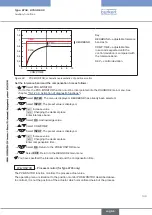
Description of the histogram of the dwell time density
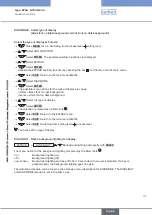
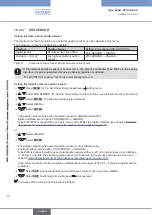
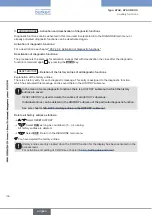
The histogram indicates how long the actuator has stopped in a specific position.
For this purpose the stroke range is divided into 10 classes.
The current position of one of the 10 classes is assigned to each scan time.
<10
%
11
- 20%
21
- 30%
31
- 40%
41
- 50%
51
- 60%
61
- 70%
71
- 80%
81
- 90%
91
- 100%
Class
1
2
3
4
5
6
7
8
9
10
Figure 42:
CMD-Class; position classes
english
Summary of Contents for 8792
Page 196: ...www burkert com ...

