


Data Analysis Windows
82
•
Spreadsheet.
Shows a spreadsheet of the data collected in the selected wells
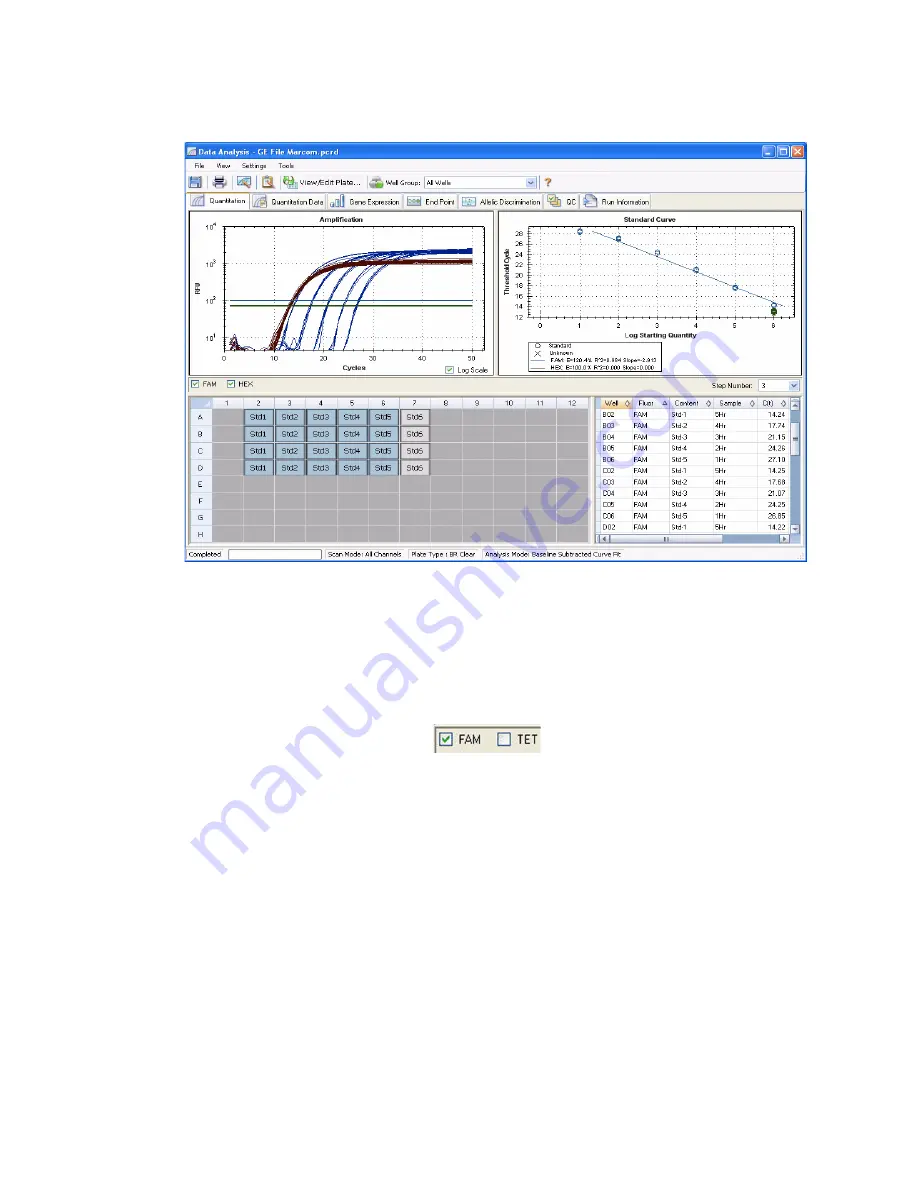
Figure 80. Layout for the Quantitation tab in Data Analysis window.
Fluorophore Selector
To select the fluorophore data to display in the Quantitation tab charts and spreadsheets, click
the fluorophore selector below the Amplification chart (Figure 81). Click the box next to the
fluorophore name to show or hide the fluorophore data throughout the data analysis window.
Figure 81. Fluorophore selector with FAM selected.
Trace Styles Window
Open the Trace Styles window (Figure 82) to adjust the appearance of traces in the
amplification and melt curve charts in the Quantitation and Melt Curve tabs.
To open this window, follow these steps:
1. Select only one fluorophore in the fluorophore selection boxes (Figure 81) under the
Amplification chart.
2. Click the
Trace Styles
button in the Data Analysis toolbar, or select
Settings > Trace
Styles
in the Data Analysis menu bar.
Summary of Contents for CFX384
Page 9: ...Table of Contents viii ...
Page 49: ...Protocols 40 ...
Page 89: ...Data Analysis Overview 80 ...
Page 149: ...Resources 140 ...
Page 157: ...Index 148 ...


