X90 mobile modules
X90 mobile system User's manual V 1.20 - Translation of the original manual
245
Information about using FFT
Window functions
Depending on the signal structure and boundary conditions, discontinuities may occur at the time window limits of
the extract taken. These reflect partial oscillations that do not exist at all in reality.
These discontinuities arise if the period of the sampling does not correspond to an integral multiple of the period of
the time signal. This occurs with practically every measured signal since this is composed of a number of signals
with different period durations.
Window functions are used to suppress these discontinuities. This is done by multiplying the input signal with the
window function and supplying the Fourier transform with the resulting signal.
Common window functions are:
•
Triangular window
•
Hann window
•
Hamming window
All of these functions share the fact that they approach zero at the edges, so the periodic continuation now no
longer has any jump discontinuities.
Raw signal
Hann window
Resultant
Amplitude
Time
Hann
Hann
Delta
Time
Signal
strength
in
%
100
0
Time signal with Hann window
Comparing window functions
Information:
The Hann window is used in the X90CM480 module.
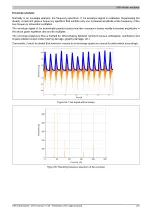
Sampling
Scanning or sampling refers to the recording of an analog value at certain intervals.
At defined times, the precise voltage level of the signal is recorded and stored. The distance Δt (Delta t) between
the recording points is called the sampling interval.
Time
Sampling
Amplitude
Figure 76: Sampling of a curve
If the actual sampling rate is many times higher than the theoretically required sampling frequency, it is called
"oversampling". The reduction of the sampling rate to the required rate is called "downsampling".
If the Fourier transform is used in accordance with the sampling theorem on a purely sinusoidal signal whose fre-
quency corresponds exactly with a node in the frequency spectrum (whole number multiple of the frequency res-
olution), then this signal appears as a single line in the spectrum. If the frequency of the sinusoidal oscillation does
not fall on a node in the frequency spectrum, then it will appear as 2 neighboring lines whose vertical relationship
to each other is indirectly proportional to the frequency deviation of the respective node.
In practice, a pure sinusoidal signal will rarely occur. Rather, a signal will consist of a multitude of sinusoidal
oscillations of different frequencies. As a result, the resulting frequency spectrum also consists of a large number
of lines.


