


2. Adjust the Switched Filter Limiter DAC for each
of the frequency bands as follows:
a. At the
$
prompt on the PC display, type:
calterm 145
and press <ENTER>.
b. On the 56100A Network Analyzer, set the
Resolution to 0.2 dB and adjust the offset to
center the top of the triangle waveform on the
display.
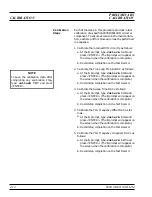
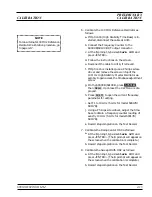
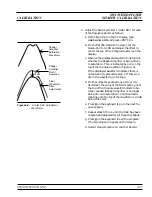
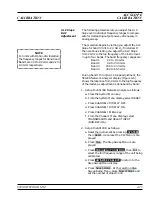
c. Observe the displayed waveform to determine
whether the Shaper Amplifier is being driven
to saturation. This is indicated by a dip in the
top of the triangle waveform (Figure 4-4).
If the displayed waveform indicates there is
not saturation, proceed to step e. If there is a
dip in the waveform, go to step d.
d. On the computer keyboard, use 8, 9, or 0 to
decrement the value of the DAC's setting until
the top of the triangle waveform starts to be-
come rounded (Shaper Amplifier is no longer
being driven to saturation). Continue decre-
menting until the top of the waveform is 0.3 dB
below this point.
e. Press
Q
on the keyboard to go to the next fre-
quency band.
f. Repeat steps b thru e until the DAC has been
checked and adjusted for all frequency bands.
g. Press
Q
on the keyboard to exit the program.
(The
$
prompt will appear on the screen.)
h. Record step completion on the Test Record.
690XXB/691XXB MM
4-21
SWITCHED FILTER
CALIBRATION
SHAPER CALIBRATION
Shaper
Amplifier
Saturation
Waveform
0.3 dB
Final
Waveform
After
Adjustment
Shaper
Amplifier
Out of
Sauration
Figure 4-4.
Limiter DAC Adjustment
Waveforms
Summary of Contents for 680 C Series
Page 4: ......
Page 5: ......
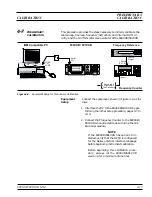
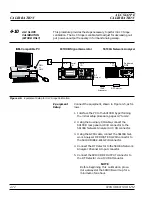
Page 13: ...Figure 1 1 Typical Series 690XXB 691XXB Synthesized CW Signal Generator Model 69187B Shown ...
Page 61: ......
Page 97: ......
Page 205: ......
Page 207: ......
Page 221: ......
Page 225: ......
Page 241: ......
Page 259: ......
Page 275: ......
Page 285: ......
Page 289: ......
Page 299: ......
Page 303: ......
Page 315: ......


