1-27
IM 253710-01E
Functions
1
Note
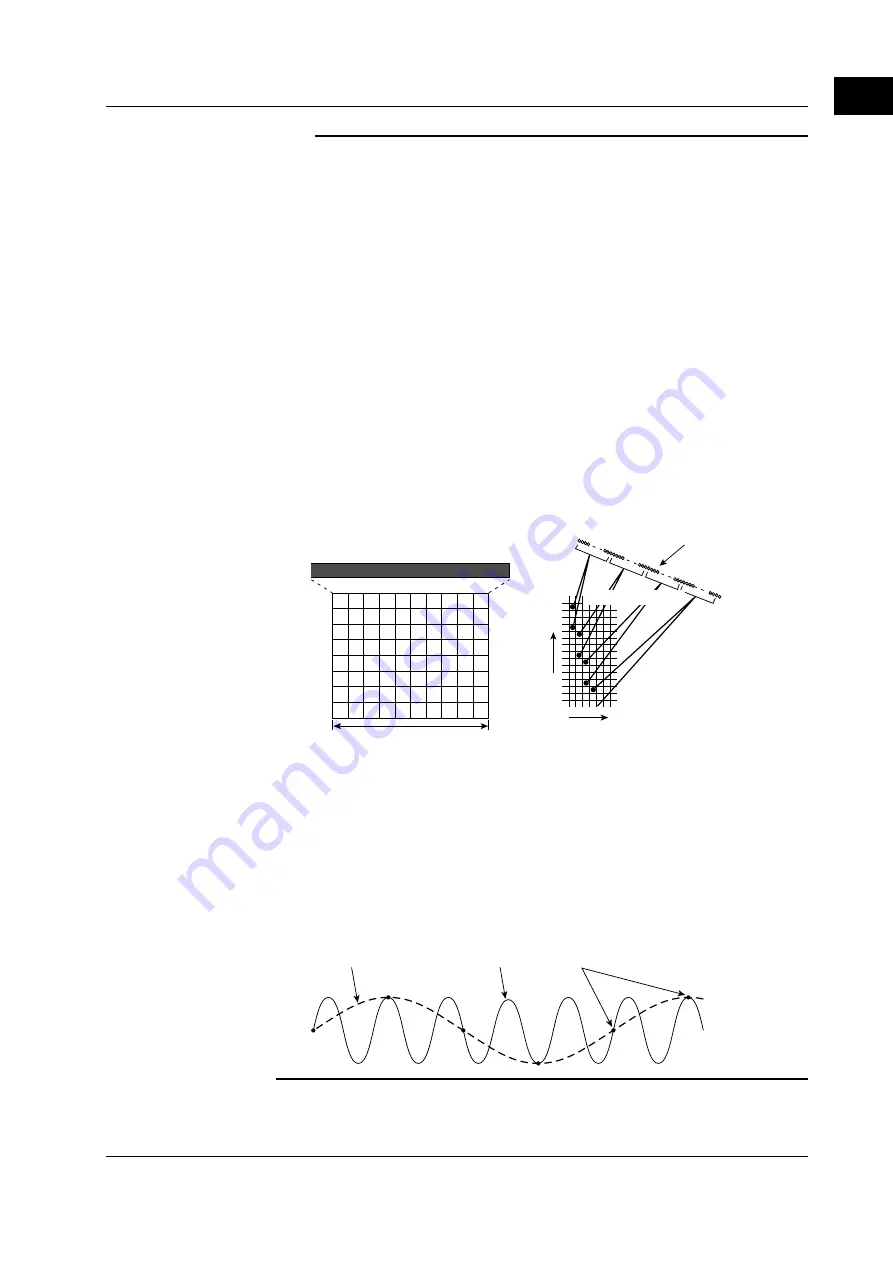
Number of displayed points on the screen
When displaying the sampled data as a waveform on the screen, the data points are
displayed in segments called rasters. There are 501 rasters in the time axis direction on one
screen.
Recall that the sampled data are stored into the acquisition memory according to the
sampling rate. Then, the display record length of the data is shown on the screen. The
display record length varies depending on the record length and observation time. For the
relationship between the observation time, sampling rate, and record length, see Appendix 1
“Relationship between the Observation Time, Sampling Rate, and Record length.”
Because the number of display segments (number of displayed points) on the screen is
constant while the display record length changes, there are times when the number of
displayed points and the display record length do not match. In these cases, the following
two scenarios occur.
•
When the display record length is larger than the number of displayed points
For each time segment, the instrument performs P-P compression. P-P compression
refers to the determination of the maximum and minimum values for each segment. One
raster will display these two points.
•
When the display record length is less than the number of displayed points
The instrument interpolates the display. For details, see “Display Interpolation of the
Waveform.”
501 rasters
0
500
Sampled data
Time axis
On the screen
Display record length
Vertical axis
P-P compression
Acquiring the sampled data
The sampling rate changes when the measurement period is changed. The data can be
sampled at a maximum rate of 5 MS/s. The input signal is sequentially sampled and stored in
the acquisition memory.
Aliasing
When the sampling rate is comparatively low with respect to the input signal frequency, the
measurement may be in error. In this case, some of the harmonics will appear at low
frequencies due to the effects described by the Nyquist sampling theorem. This phenomenon
is called aliasing.
Aliased signal
Input signal
Sampling point
1.6 Waveform Display


