1-26
IM 253710-01E
1.6
Waveform Display
Vertical (Amplitude) Axis and Horizontal (Time) Axis
Vertical (amplitude) axis
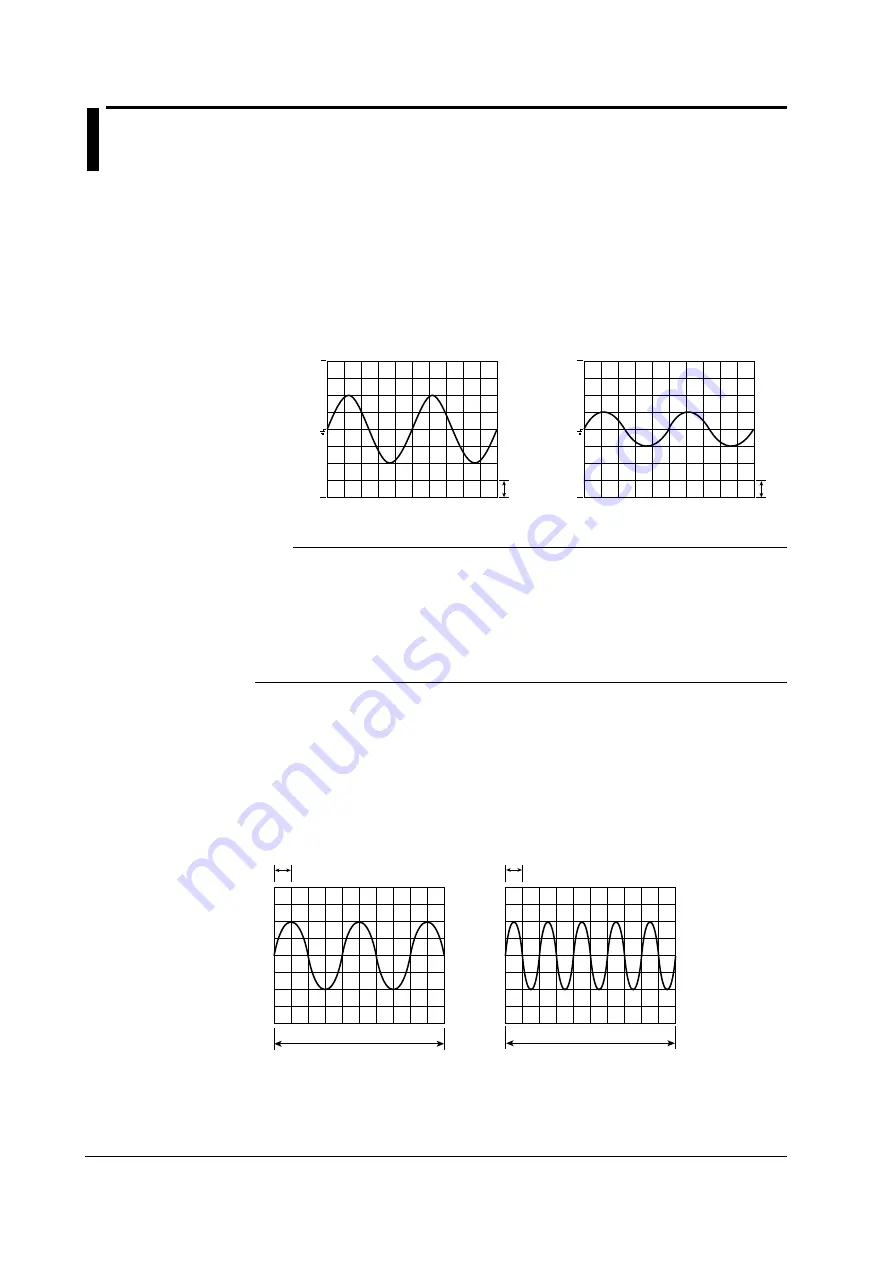
The vertical display range is set to the specified measurement range. For example, if
the voltage measurement range is set to “300 Vpk,” then the display range is set so
that the top of the screen is 300 Vpk and the bottom is –300 Vpk with the zero input
line at the center.
1 grid (1 div)
= 150 V
1 grid (1 div)
= 75 V
When the measurement range is
set to “300 Vpk”
When the same signal is measured
with the measurement range set to
“600 Vpk”
Zero input line
300 Vpk
–300 Vpk
600 Vpk
–600 Vpk
Note
Display resolution of the vertical axis
Setting a measurement range that is close the maximum amplitude of the signal results in a
more accurate waveform display. The instrument uses a 12-bit A/D converter, which results
in the quantization of the sampled data using 4096 discrete levels. However, the waveform is
displayed using 512 levels per grid. On the other hand, when using cursors (explained later)
to measure the data from the waveform, the data are converted to a resolution of up to 16
bits.
Horizontal (time) axis
The instrument displays the sampled data of the voltage or current within the
observation time. The horizontal axis corresponds to the time axis of the observation
time. The sampled data on the screen become more recent as you move from the left
to the right on the horizontal axis. The grid on the screen divides the observation time
into 10 equal sections. For example, if the observation time is set to 100 ms, then
one grid (1 div) corresponds to 10 ms.
1 grid (1 div) = 10 ms
1 grid (1 div) = 20 ms
100 ms
(Observation time)
200 ms
(Observation time)


