


Analyzer R&S
UP300/350
E-1147.2759.00
6-252
Operating Manual, 11/2007
Displaying and
analyzing
measurement
results
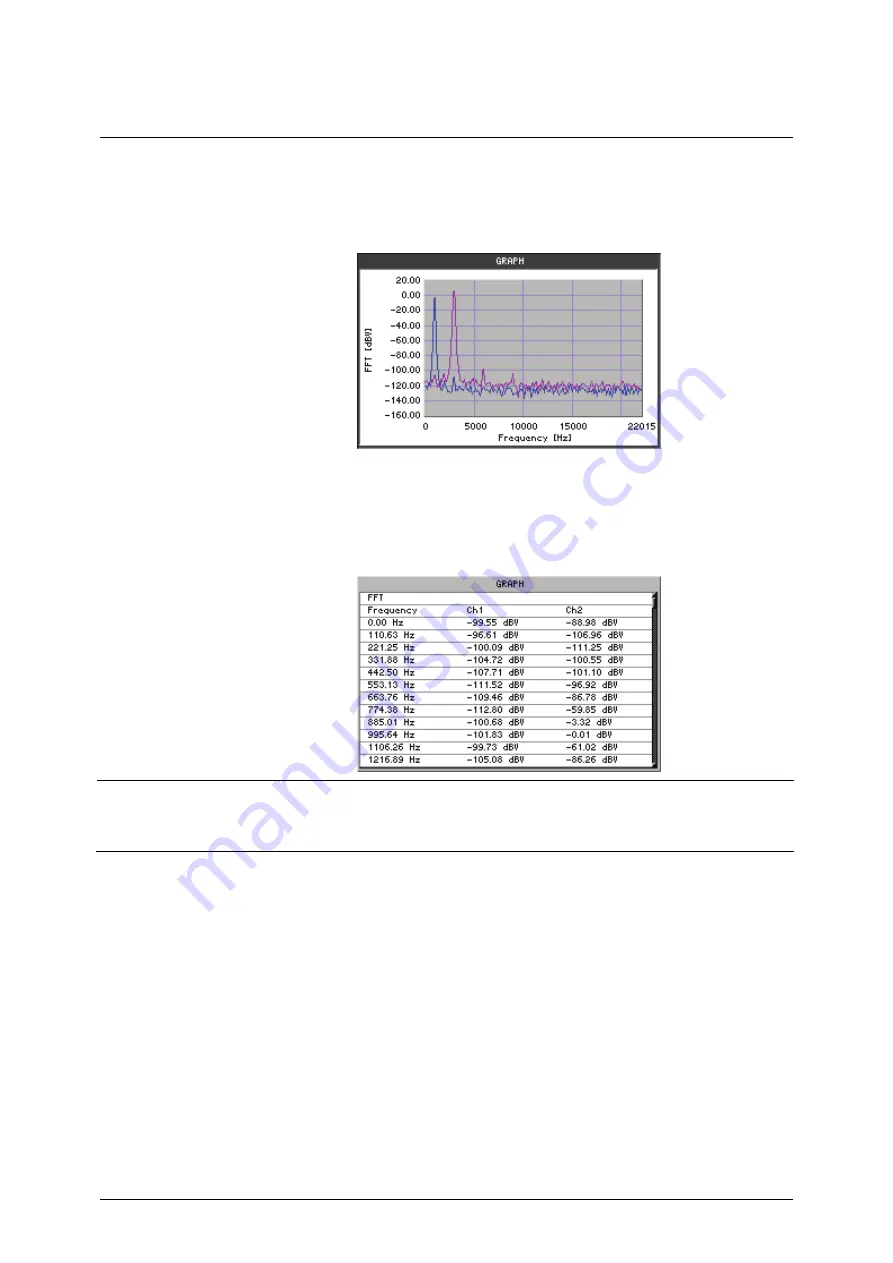
Frequency spectrum
Select the
SPECTRUM
display mode in the Graph menu (
Ê
A measurement diagram with the frequency spectrum is shown in the
display area.
Note:
In the Graph menu, you can change the graphic display area
(
Ê
6-292, 6-296) and analyze the trace using the cursors (
Ê
List of measurement values
Select the
LIST OF VALUES
display mode in the Graph menu (
Ê
The FFT frequency and level values are displayed.
Note:
When you activate the measurement function, the R&S UP300/350
begins the continuous measurement. However, you can also start and stop
the measurement manually (
Ê
Содержание Smart Instruments UP300
Страница 1: ...11 2007...
Страница 20: ...R S UP300 350 E 1147 2759 00 1 20 Operating Manual 11 2007...
Страница 30: ......


