96 .
Flexar SQ 300 MS User’s Guide
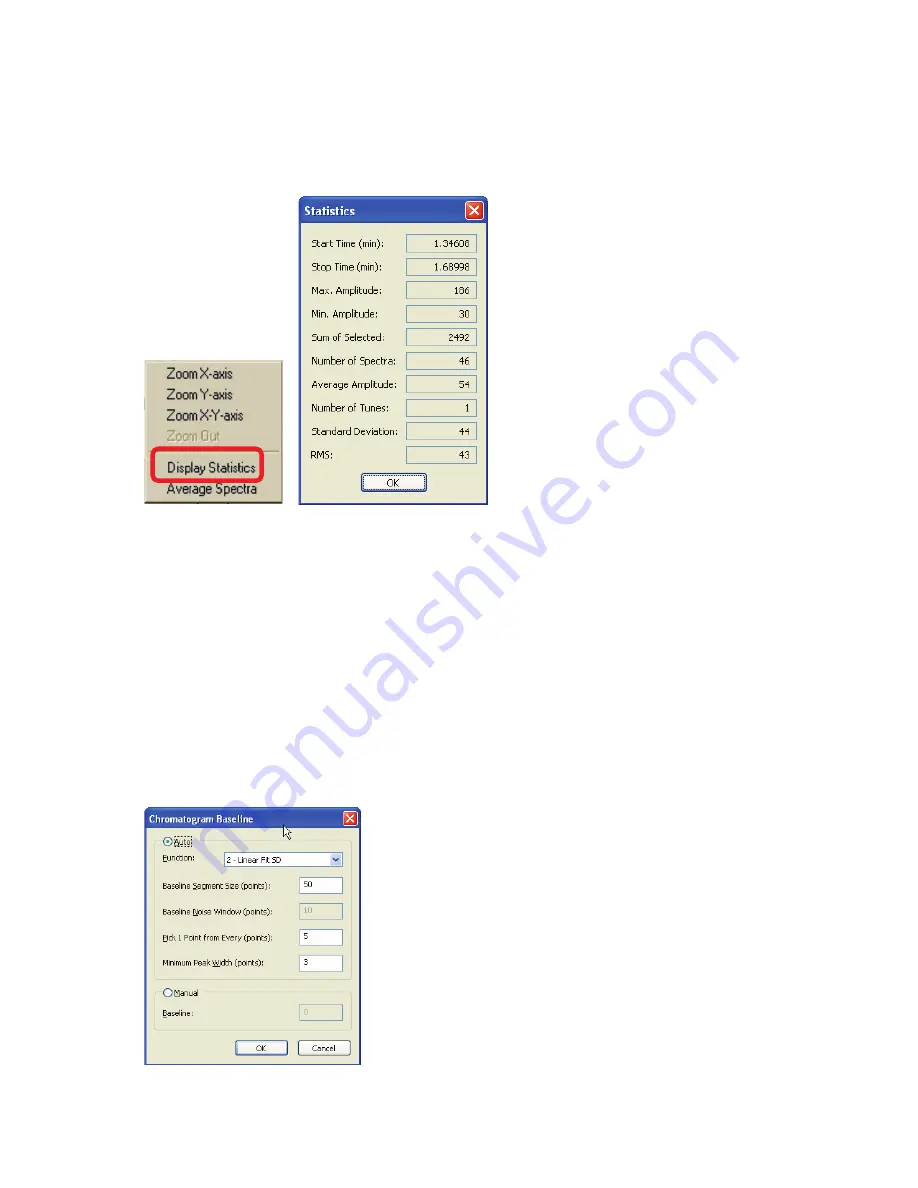
Displaying Statistics
Left-click and drag a box around a peak of interest, release the button and select
Display
Statistics
.
About Right Mouse Click Menus
Each graph view contains a graphical package which includes functions to modify and export graphs.
Individual functions can be selected or the
Customization Dialog
can be used.
Baseline Calculation
1.
When a TIC, EIC, or BIC window is selected, select
Baseline
from the
Evaluation
menu.
2.
To calculate an
Auto
baseline with the morphological function, select
Auto
and the
Function
APB
morph.
3.
Enter shortest
Baseline Segment Size
, and
Baseline Noise Window
.
Содержание FLEXAR SQ 300 MS
Страница 1: ... 520 5 5 64 06 86 5 6 8 Chromera Chromatography Data System ...
Страница 2: ......
Страница 3: ...Chromera and Flexar SQ 300 MS User s Guide ...
Страница 8: ...6 Flexar SQ 300 MS User s Guide ...
Страница 9: ...Starting ...
Страница 14: ...12 Flexar SQ 300 MS User s Guide ...
Страница 15: ...Starting Chromera ...
Страница 36: ...34 Flexar SQ 300 MS User s Guide ...
Страница 37: ...Initial Process to Configure an Optimal Tune and Method on the SQ 300 MS Detector ...
Страница 55: ...Creating Methods and Sequences ...
Страница 68: ...66 Flexar SQ 300 MS User s Guide ...
Страница 69: ...Starting Data Acquisition ...
Страница 77: ...Analyze Results in Post Run ...
Страница 103: ...Analyze Results in Post Run 101 9 Select Print from the File menu in Microsoft Excel to print the table ...
Страница 104: ...102 Flexar SQ 300 MS User s Guide ...
Страница 105: ...Evaluating Mass Spectra ...
Страница 119: ......


