Analyze Results in Post Run. 77
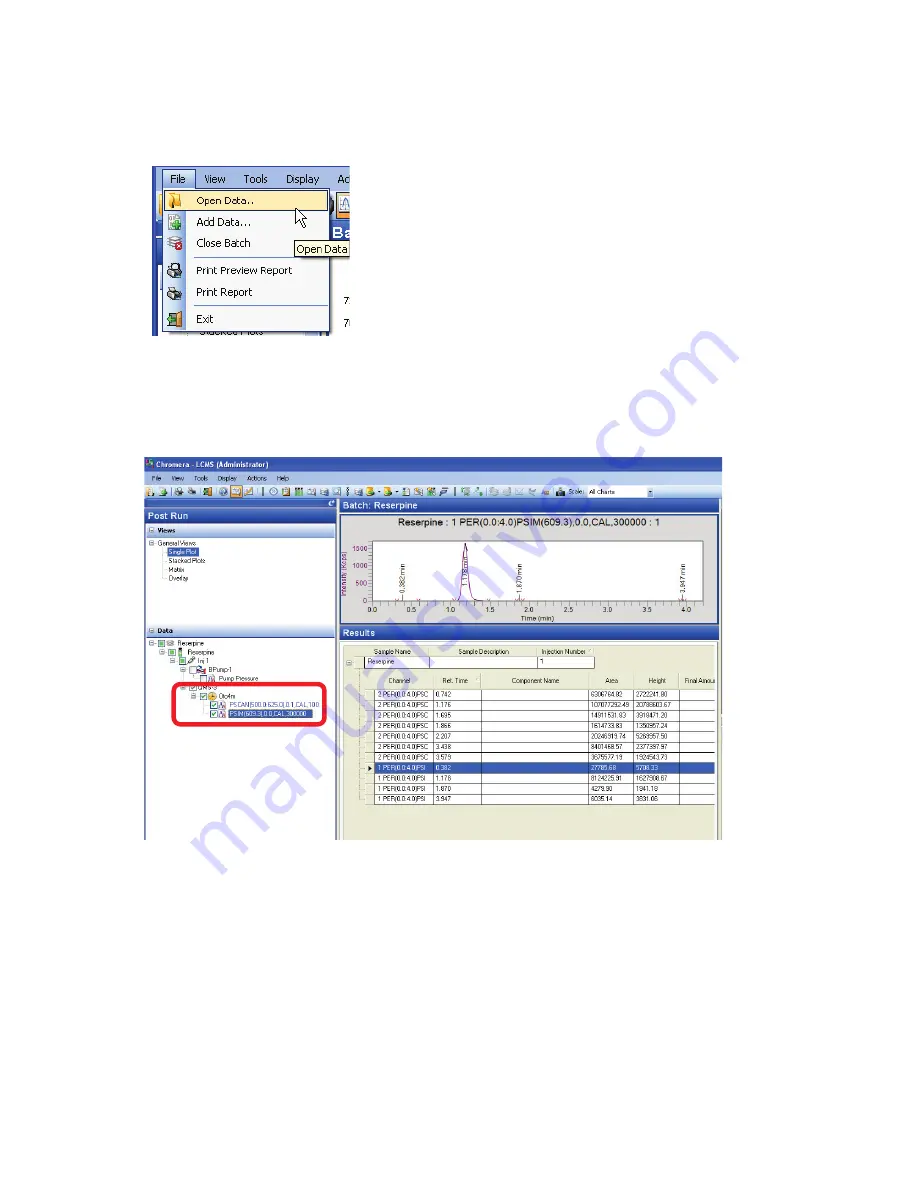
You could also search for previously stored data by selecting
Open Data
from the
File
menu.
This displays the
Data Selector
. Search and select
the data you want to analyze then click
Open
.
2.
Uncheck the pump pressure
(BPump-1)
.
3.
Click on
SIM
.
A SIM chromatogram is displayed in the top plot window and the SIM data are displayed in the
Results
pane.
4.
Click on
Scan.
The TIC (total ion chromatogram) is displayed in the top plot window and the TIC chromatographic
data are displayed in the
Results
pane.
Содержание FLEXAR SQ 300 MS
Страница 1: ... 520 5 5 64 06 86 5 6 8 Chromera Chromatography Data System ...
Страница 2: ......
Страница 3: ...Chromera and Flexar SQ 300 MS User s Guide ...
Страница 8: ...6 Flexar SQ 300 MS User s Guide ...
Страница 9: ...Starting ...
Страница 14: ...12 Flexar SQ 300 MS User s Guide ...
Страница 15: ...Starting Chromera ...
Страница 36: ...34 Flexar SQ 300 MS User s Guide ...
Страница 37: ...Initial Process to Configure an Optimal Tune and Method on the SQ 300 MS Detector ...
Страница 55: ...Creating Methods and Sequences ...
Страница 68: ...66 Flexar SQ 300 MS User s Guide ...
Страница 69: ...Starting Data Acquisition ...
Страница 77: ...Analyze Results in Post Run ...
Страница 103: ...Analyze Results in Post Run 101 9 Select Print from the File menu in Microsoft Excel to print the table ...
Страница 104: ...102 Flexar SQ 300 MS User s Guide ...
Страница 105: ...Evaluating Mass Spectra ...
Страница 119: ......


