10. Viewing/Analyzing Graph on EQ-GraphViewer
10-5
10.4. Configuring Graph View
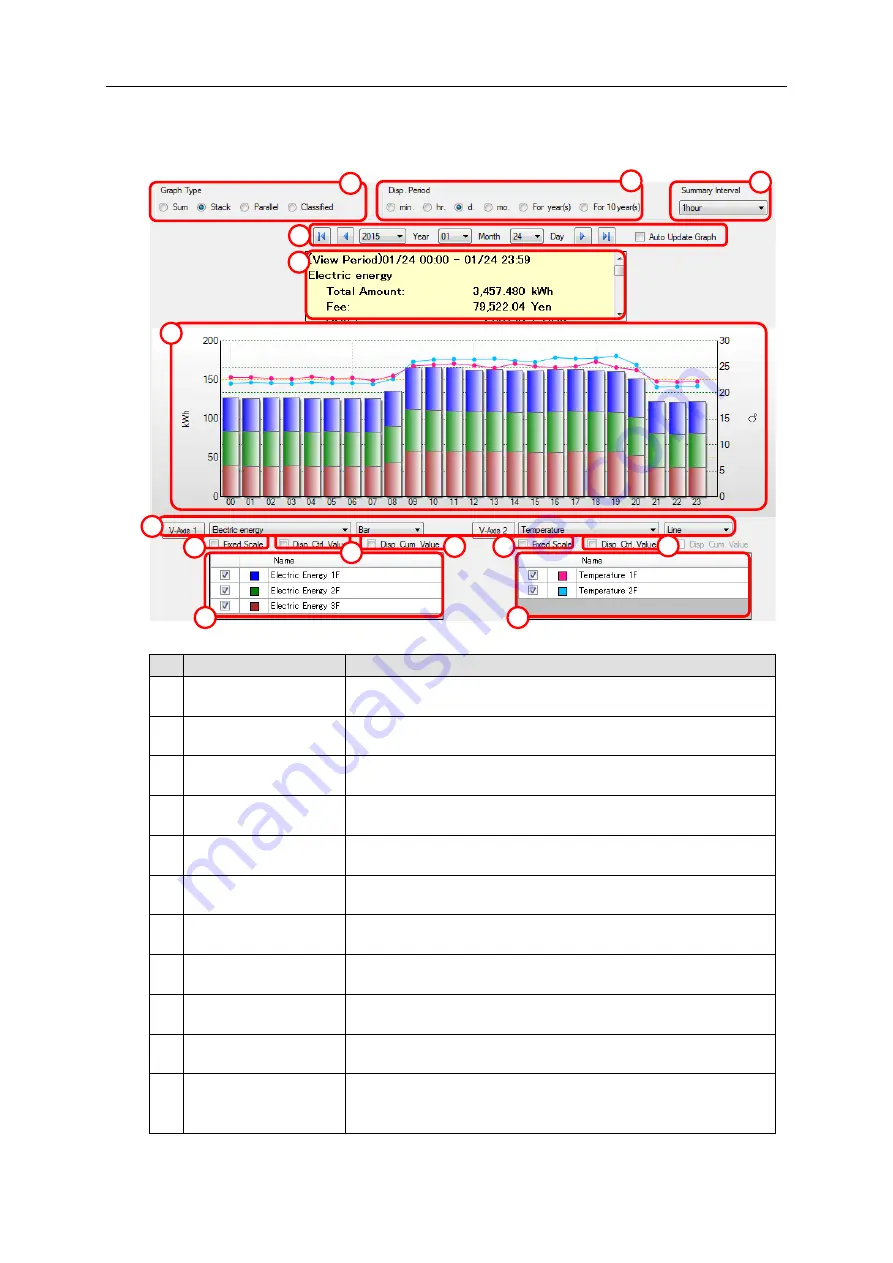
To configure graph view settings, use the main screen.
No.
Item
Description
1
Graph Type Setting
Area
Specify a type of a graph to draw in the graph area.
2
Disp. Period Setting
Area
Specify a period of a graph to draw in the graph area.
3
Summary Interval
Setting Area
Specify a unit of summary of a graph to draw in the graph area.
4
Date/Time Setting
Area
Specify a date & time of a graph to draw in the graph area.
5
Summary Area
Shows summary of data being displayed, e.g. total and average
values.
6
Graph Area
Shows a summary graph. You can scale up and down the
horizontal axis (temporal axis) by mouse operation.
7
Data Type Setting
Area
Specify a category of data to draw in the graph area for
longitudinal axes 1 and 2 respectively.
8
Fixed Scale check box Select if the scaling should be automatically changed based on
data or fixed to the current one for longitudinal axes 1 and 2.
9
Disp. Ctrl. Value check
box
Select if the control value should be displayed or not on the
longitudinal axes 1 and 2.
10 Disp. Cum. Value
check box
Switches the graph view to display the cumulative value. This
option is valid only for the graph of integrated quantity.
11 Disp. Target Setting
Area
Shows a list of channels in the selected channel group.
Select a check box of the channel to draw a graph in the graph
area.
5
11
4
6
7
8
1
3
2
11
9
8
9
10
Содержание EQ100-E
Страница 1: ...Sensor Network Server Model EQ100 E User s Manual Catalog No N196 E1 01H ...
Страница 55: ...2 Specifications 2 24 2 5 Dimensions Top View Front View Unit mm ...
Страница 92: ...7 EQ100 Settings 7 3 4 Click OK to view the EQ project setup menu Setting Menu ...
Страница 197: ...9 Web UI Function 9 24 3 In the Save As dialog box enter a destination to save and click Save Download is completed ...
Страница 255: ... MEMO ...


