9. Web UI Function
9-20
9.9. Maintenance > System
When you select [System] from the menu displayed when the cursor is over the [Maintenance]
icon on the screen top, the system screen appears.
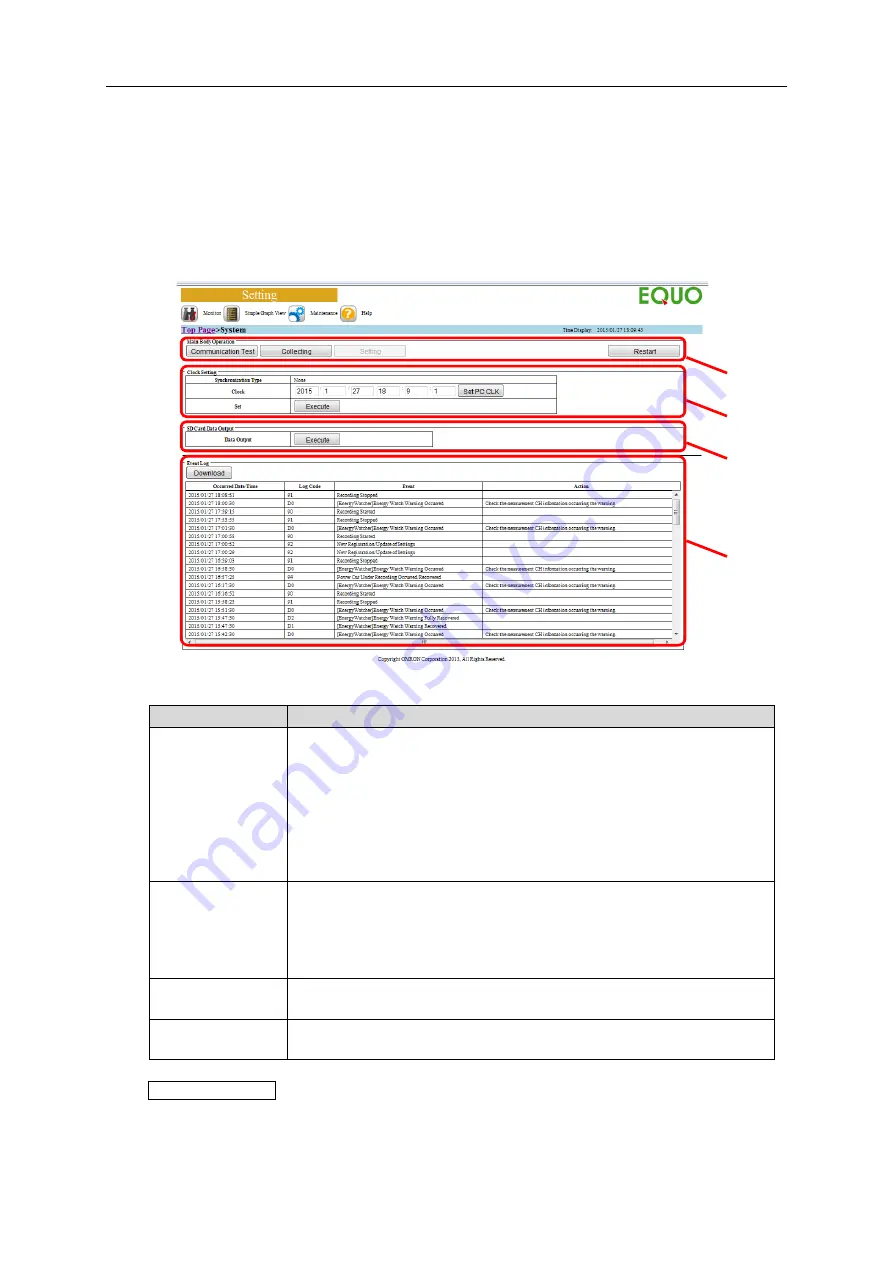
On the system screen, you can check and configure an EQ100 operation status, time setting,
SD card data output, and event logs.
■
System Screen Configuration
■
Description of Display Areas
Item
Description
EQ100 Operating
Area
You can change an EQ100 operating status.
[Communication Test]: Starts communication test. During the
communication test, you can view the communication status on the
current value monitor screen.
[Collecting]: Starts collecting (EQ100 transitions to the collecting
status).
[Setting]: Stops collecting (EQ100 transitions to the setting status).
[Restart]: Resets EQ100.
Clock Setting Area If the time synchronization type is [RTC], entering date and time and
clicking the [Execute] button configures the EQ100 built-in clock.
Pressing the [Set PC CLK] button sets the PC's current time to the time
setting area.
Press the [Execute] button to set.
SD Card Data
Output Area
Clicking the [Execute] button outputs collected data files and event log
files to the SD card attached to the SD card slot.
Event Log Area
A list of occurred events is displayed. Clicking the [Download] button
allows download of event log files.
Reference
- The event log area view is not automatically updated. To view the latest information, reload
the page of the browser.
EQ100
Operating Area
Clock Setting
Area
SD Data Output
Area
Event Log Area
Содержание EQ100-E
Страница 1: ...Sensor Network Server Model EQ100 E User s Manual Catalog No N196 E1 01H ...
Страница 55: ...2 Specifications 2 24 2 5 Dimensions Top View Front View Unit mm ...
Страница 92: ...7 EQ100 Settings 7 3 4 Click OK to view the EQ project setup menu Setting Menu ...
Страница 197: ...9 Web UI Function 9 24 3 In the Save As dialog box enter a destination to save and click Save Download is completed ...
Страница 255: ... MEMO ...


