9 Visualization
Maschinenfabrik Reinhausen GmbH 2020
218
4453918/14 EN
ETOS
®
TD
7. Use the mouse to drag a selection window in order to zoom into the dia-
gram. Select the
button to reduce the diagram back to its original
size.
8. Select the
button to save the displayed measured values as a csv file.
Trend curves
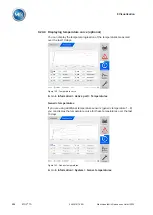
If you call up the measured value recorder using a PC, you can display a
trend curve instead of the measured values. The trend curve can, for exam-
ple, be a moving average over a configurable time period.
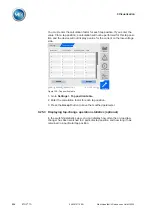
Figure 150: Creating trend curves
To create the trend curves, proceed as follows:
1. Call up the measurement recorder and the desired measured value se-
ries.
2. Press the
Trend
button.
3. Select the desired
measured values
.
4. Select the desired
trend function
.
5. Entire the desired
time period
for the calculation of the trend curve.
6. Press the
Accept
button to display the trend curves.
ð
The trend curve is displayed. Measured values that are displayed as trend
curves are marked with the
symbol.
9.24.3 Setting the measured value recorder
The measured value recorder records a maximum of 500,000 values per
measured variable. Depending on the set average value interval, the mea-
sured value recorder can display the measured values over a shorter or
longer time period:
▪ Average value interval = 1 s: approx. 6 days
▪ Average value interval = 86,400 s (= 24 h): approx. 1340 years
Содержание ETOS TD
Страница 1: ...Motor drive unit ETOS TD Operating Instructions 4453918 14 EN ...
Страница 329: ...15 Technical data Maschinenfabrik Reinhausen GmbH 2020 329 4453918 14 EN ETOS TD 15 2 2 Drawings 15 2 2 1 ETOS TD S ...
Страница 330: ......
Страница 331: ...15 Technical data Maschinenfabrik Reinhausen GmbH 2020 331 4453918 14 EN ETOS TD 15 2 2 2 ETOS TD L ...
Страница 332: ......
Страница 333: ...15 Technical data Maschinenfabrik Reinhausen GmbH 2020 333 4453918 14 EN ETOS TD 15 2 2 3 ETOS TD XL ...
Страница 334: ......
Страница 355: ......


