9 LTOS7 Management and Monitoring
9.1.8.16 System Utilization
With the latest SyncMon version it is possible to configure up to 1000 nodes to monitor. The request and
logging interval can be set to 1s. Be aware that system CPU will be heavily used in case of high counts of
nodes and low request and log-intervals. This could decrease the NTP server performance as well.
Examples:
•
10 monitoring nodes with log-interval = 1s will store 70MBytes (69194kBytes) per day – the default size
of the flash used for SyncMon logging is about 400MB – so 5 days can be stored on internal flash disk.
•
100 monitoring nodes with log-interval = 1s will store 700MB per day – then data logging will stop if the
flash is full – the log rotating for SyncMon will be started at 00:00 UTC and will erase data files older
than 2 days. The CPU utilization will increase about 10%.
•
100 monitoring nodes with request interval = 1s and log-interval = 64s will store about 12MBytes per
day – so about 40 days can be stored on internal flash disk. The CPU utilization will increase about 7%.
•
900 monitoring nodes with request interval = 1s and log-interval = 64s will store about 100MBytes per
day – so about 4 days can be stored on internal flash disk. The CPU utilization will increase about 45%
–
this is critical for the NTP server performance of the device.
The size of a data file per day depends on the logging interval and has a size of about 110kB if log-interval is
64s.
9.1.8.17 Sync Monitor Status files via CLI
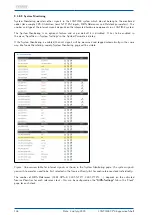
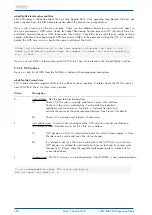
The current status of the monitored nodes as displayed in the Web-GUI is stored in an ASCII file /var/lo /sync-
mon_node_status, updated after every full scan of the configured nodes and can be accessed over CLI.
172.27.19.11:
-
0.000010202 -
0.000090331
0.000052625 8
0
1
0
0
0
Normal Operation
172.27.101.90:
0.000000000 0.000000000
0.000352269 2
0
0
0
0
3
Error:Not reachable
172.27.101.143:
0.000000000 0.000000000
0.000000000 0
0
0
0
0
3
Error:Not reachable
172.27.19.98:
0.000000000 0.000000000
0.000000000 0
0
0
0
0
3
Error:Not reachable
172.27.19.70:
0.000000030 -
0.000000035
0.000007749 9
0
0
0
0
0
Normal Operation
#
Net Sync Monitoring Status with total 15 Nodes (updated at ...)
EC:46:70:00:8F:64: 0.000000000 0.000000000
0.000000000 0
0
0
0
0
6
Error:not active
ESI-Module:
0.000001819 0.000001839
0.000000000 0
0
0
0
0
0
Normal Operation
172.27.19.68:
0.000000109 -
0.000000013
0.000007451 9
0
0
0
0
0
Normal Operation
EC:46:70:00:8F:64: -0.000000049
-
0.000000171
0.000006273 9
0
0
0
0
0
Normal Operation
172.27.100.32:
0.000008375 0.000008375
0.000209699 1
0
0
0
0
0
Normal Operation
172.27.100.1:
0.000000899 -
0.000027105
0.000416735 1
2
0
0
0
7
Error:Auth. Failed
172.16.3.12:
-
0.028305041 -
0.028305041
0.001669302 2
0
0
0
0
1
Error:Offset exceeded
172.27.101.90:
-
0.000037604 -
0.000002865
0.000352269 2
0
0
0
0
0
Normal Operation
172.16.3.11:
-
0.005109100 -
0.005896857
0.001891819 1
0
0
0
0
0
Normal Operation
# -------------------------------------------------------------------------------------------------------------------------------------
#
PTP:OffsNode
-measured
PTP-Status
Offset
Reach
172.16.100.65:
-
0.000113960 0.000055254
0.001663415 2
0
0
3
0
0
Normal Operation
#
Node-Address
NTP:Offset
-filtered
Delay
NTP-Stratum
Auth MTIE
CntErr
CntErr
Err
Message
Figure: The status information table accessed over a CLI.
Configuration via CLI
The configuration file can be edited with a text editor directly in the command line (CLI) of the system or can
be replaced by an external prepared file. Further information can be found in the LANTIME CLI reference.
LANTIME CPU Expansion Shelf
Date: 2nd July 2020
145


