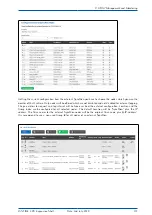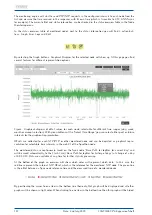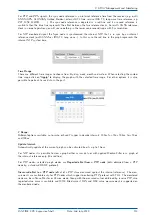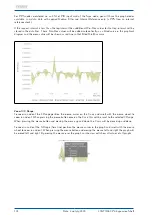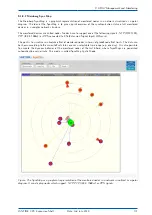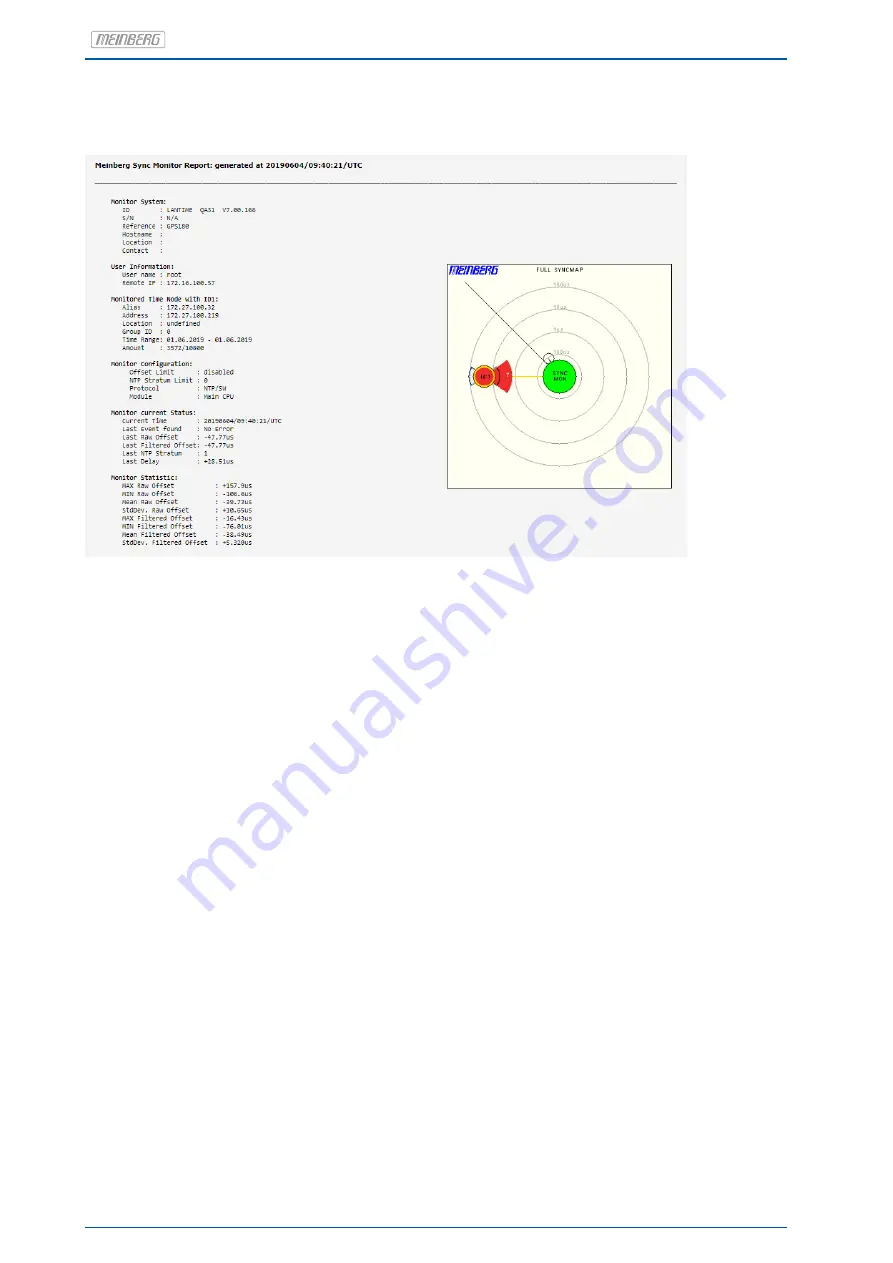
Besides, the report also provides a light version of a sync map, which includes only the selected nodes from the
table. In the sync map each individual node is highlighted and the rest are depicted in the background to get
a comparison of how the given node is performing in relation to other nodes considered in the report.
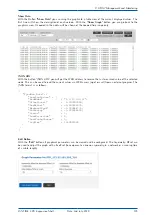
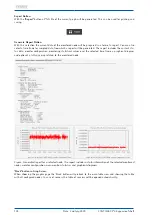
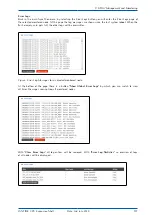
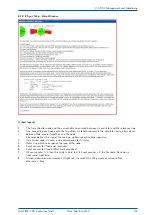
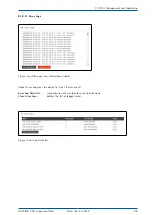
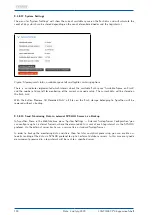
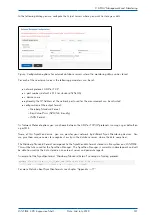
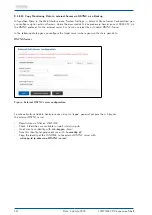
Figure: Generated report for selected nodes in the table. The report includes a status information of the
selected monitored nodes, monitor configuration, main monitor statistics and graphical diagrams.
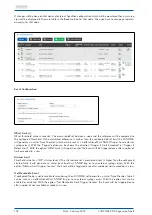
Disable measurements for selected nodes:
The nodes for which you disable measurements will get a status "Disabled". The measurements will no longer
be requested and logged for this node. The latest measured offset will be shown in the Offset column. To start
measurements again, select a node and choose
"Enable measurements for selected nodes"
.
Set parameter for selected nodes:
For the selected nodes you can set or edit a list of monitoring parameters at the same time. When you select
this feature the configuration dialog will show up where you can re-configure any of the parameters. The new
configuration will be applied to all the nodes you have selected for this action after you confirm with the
"Apply
to Nodes"
button.
Duplicate selected nodes:
The nodes which you have selected will be copied and pasted below their origin nodes. Afterwards you can
edit their parameters.
Move selected nodes to the top of the list:
The selected nodes will be moved to the top of the list.
Move selected nodes to the bottom of the list:
The selected nodes will be moved to the bottom of the list.
Delete all data of selected nodes:
The logged measurement data of the selected nodes will be permanently deleted from the internal flash.
Delete selected nodes:
The selected nodes will be permanently deleted from the list of nodes. The logged measurements up to this
point will be preserved.
130
Date: 2nd July 2020
LANTIME CPU Expansion Shelf

