9 LTOS7 Management and Monitoring
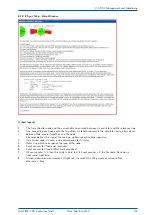
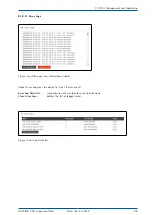
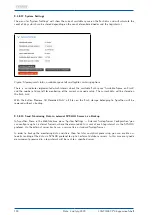
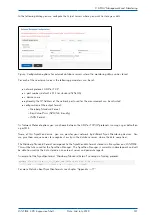
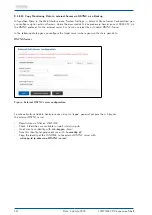
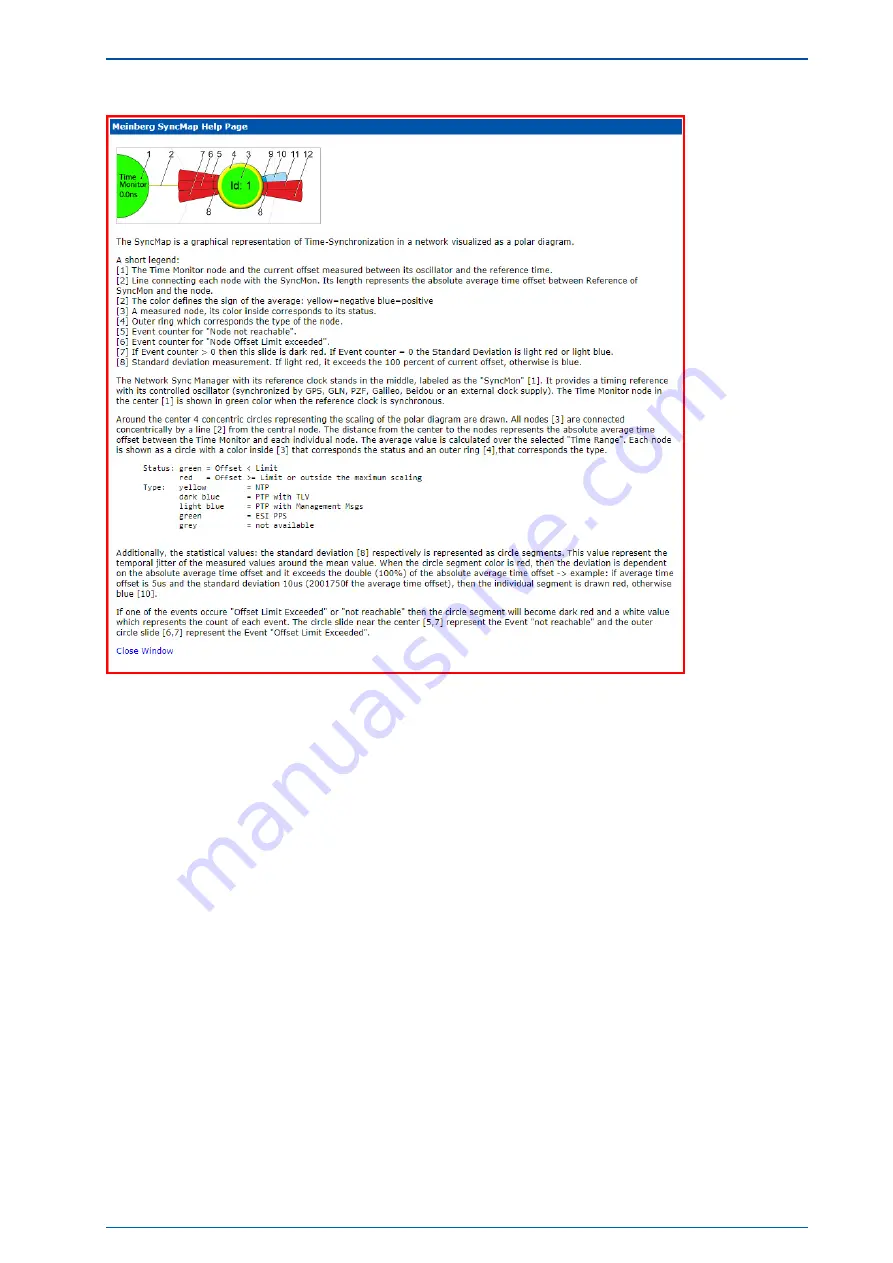
9.1.8.8 Sync Map - Help Window
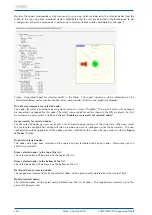
A short legend:
1
The Time Monitor node and the current offset measured between its oscillator and the reference time.
2
Line connecting each node with the SyncMon. Its length represents the absolute average time offset
between Reference of SyncMon and the node.
The color defines the sign of the average: yellow=negative blue=positive
3
A measured node, its color inside corresponds to its status.
4
Outer ring which corresponds the type of the node.
5
Event counter for "Node not reachable".
6
Event counter for "Node Offset Limit exceeded".
7
If Event counter > 0 then this slide is dark red. If Event counter = 0 the Standard Deviation is
light red or light blue.
8
Standard deviation measurement. If light red, it exceeds the 100 percent of current offset,
otherwise is blue.
LANTIME CPU Expansion Shelf
Date: 2nd July 2020
135


