9 LTOS7 Management and Monitoring
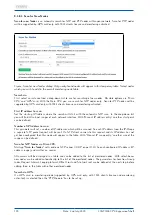
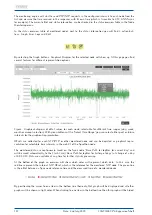
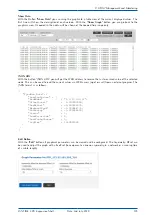
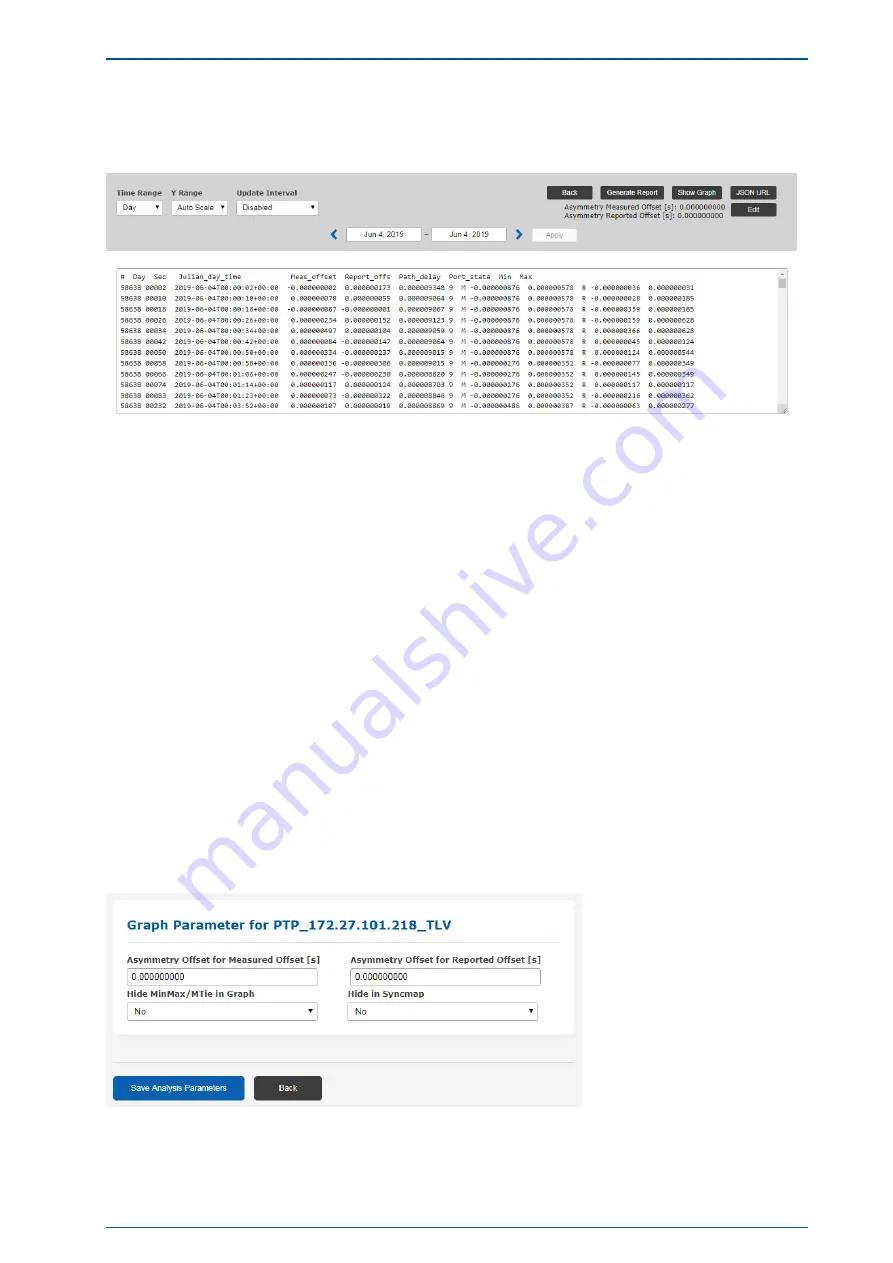
Show Data:
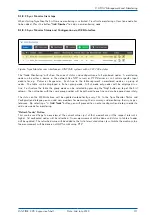
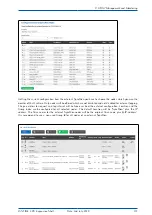
With the Button
"Show Data"
you can swap the graphic to a table view of the current displayed values. The
first line will show the description of each column. With the
"Show Graph"
button you can go back to the
graphical view. If zoomed in then data will be shown of the zoomed time range only.
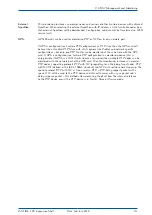
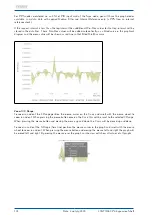
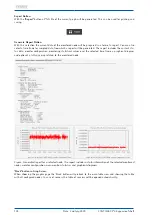
JSON URL:
With the button “JSON URL” you will get the WEB address to receive the last measured value of the selected
node. This can be used to read the current values via WEB access (wget or curl) from an external program. The
JSON format is as follows:
"LastConfigChange"
: 0,
"NodeName"
: "172.27.100.57",
"LogTime"
: 1559025024
}
"Status"
: 1,
}
"LastErrorCode"
: 0,
}
"PathDelay"
: -0.000002693,
"SyncMon_Data": {
"LastLogValues" : {
"MedianOffset"
: -0.000048733,
"RawOffset"
: -0.000050076,
"OffsetLimit"
: 0.000000000,
{
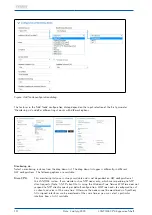
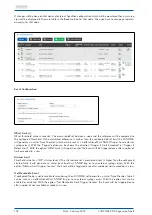
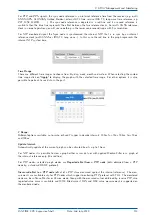
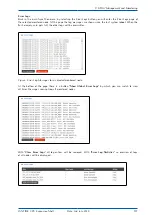
Edit Button:
With the
"Edit"
button all graphical parameters can be viewed and be configured. The Asymmetry Offset can
be used to adjust the graph with a fix offset (to compensate a known asymmetry in a network or a running time
of a cable length).
LANTIME CPU Expansion Shelf
Date: 2nd July 2020
125

