9 LTOS7 Management and Monitoring
9.1.8.6 Actions for selected Nodes
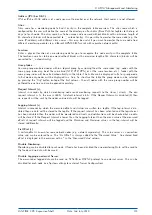
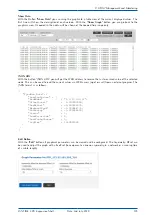
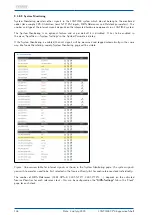
In the firmware version 7.00 and following you are able to apply given actions at the same time to a number of
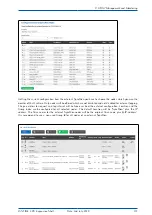
selected nodes from the table. First select the nodes which you wish to manage, either by clicking individually
a check box at the beginning of each node or by clicking on a
"+"
sign in the top row of the table if you wish
to select all nodes together.
To deselect a node which has been selected, either click again into its check box and it will be deselected
or click the
"-"
icon in the top row and you will deselect all nodes at the same time.
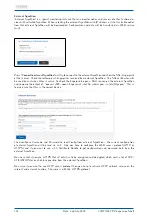
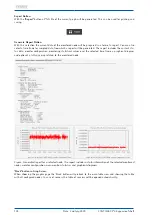
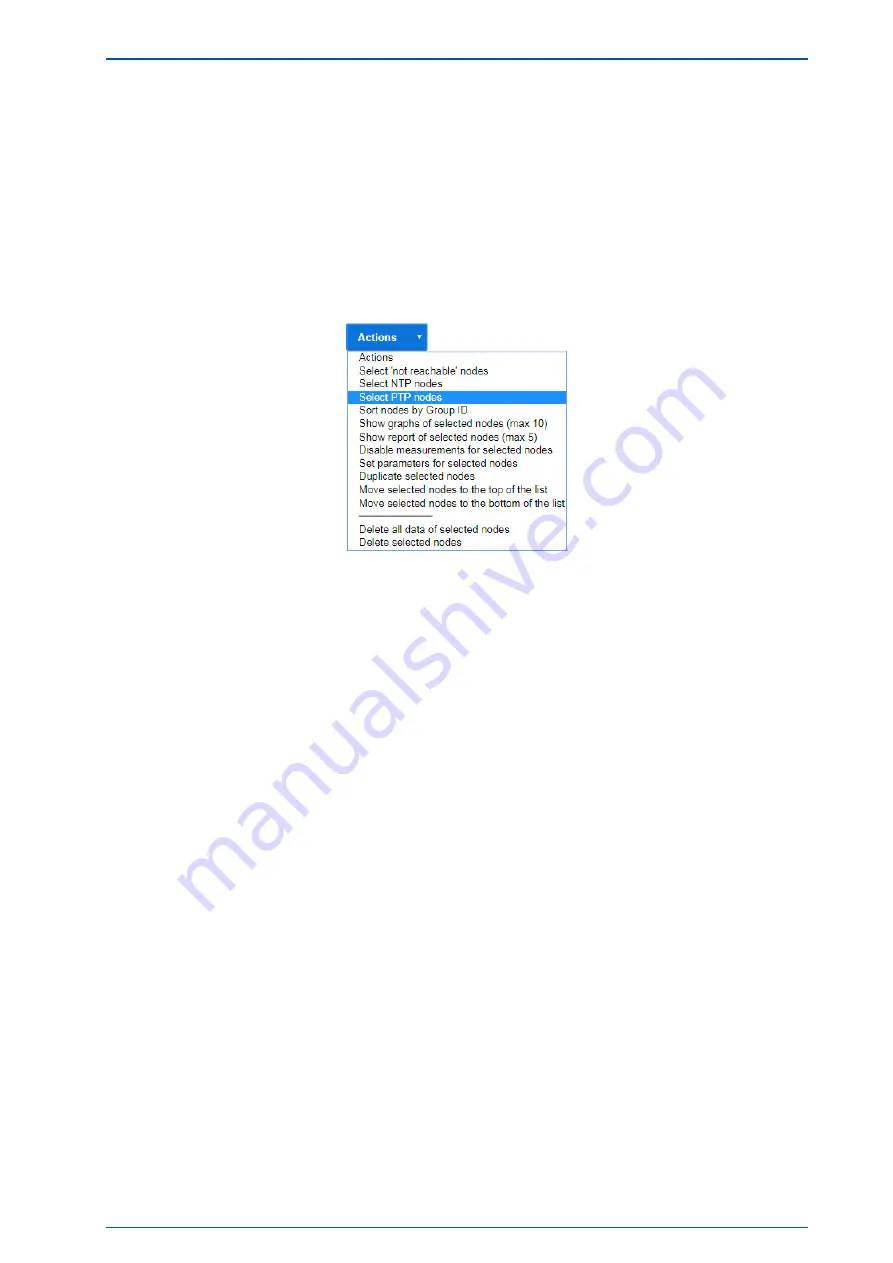
If you click the button
"Actions for selected nodes"
you will find actions which you can apply over the nodes.
Select all "not reachable" nodes:
Selection of all nodes, whose offset status shows "not reachable".
Select all NTP nodes:
Selection of all nodes, which are monitored via NTP.
Select all PTP nodes:
Selection of all nodes, which are monitored via PTP, either MGMT or with TLV messages.
Sort nodes by Group ID:
The full list of nodes will be sorted by Group ID
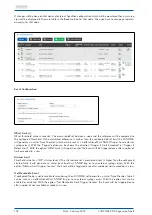
Show overview of the current day:
If none of nodes has been primarily selected than graphical diagrams of the current day will be shown in a
thumbnail form for all nodes in the table. Along with the graphical diagrams also the status information and
statistics over the current day measurements will be displayed.
Show overview of the time range:
If none of nodes has been primarily selected than graphical diagrams of the selected time range will be shown
in a thumbnail form for all nodes in the table. Along with the graphical diagrams also the status information
and statistics over the selected time range measurements will be displayed.
Show a Graphical Diagram for selected nodes
(max 10):
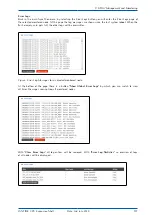
If you select up to ten nodes in the table, they can be displayed in the same graphical diagram. First, you have
to select a time frame in which the graphical diagram will be displayed.
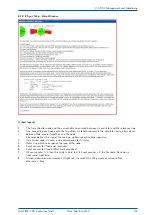
Create a Report for selected nodes
(max 5):
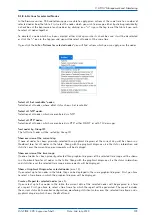
If you select up to five nodes in the table, the current data of the selected nodes will be prepared in a form
of a report. First, you have to select a time frame for which the report will be generated. The report includes
the current status data, monitor configuration, monitoring statistical values over the selected time frame and a
graphical diagram which shows the offset trend.
LANTIME CPU Expansion Shelf
Date: 2nd July 2020
129

