


2. GRAPH FUNCTIONS
2-12
2.4
Sonde Graph
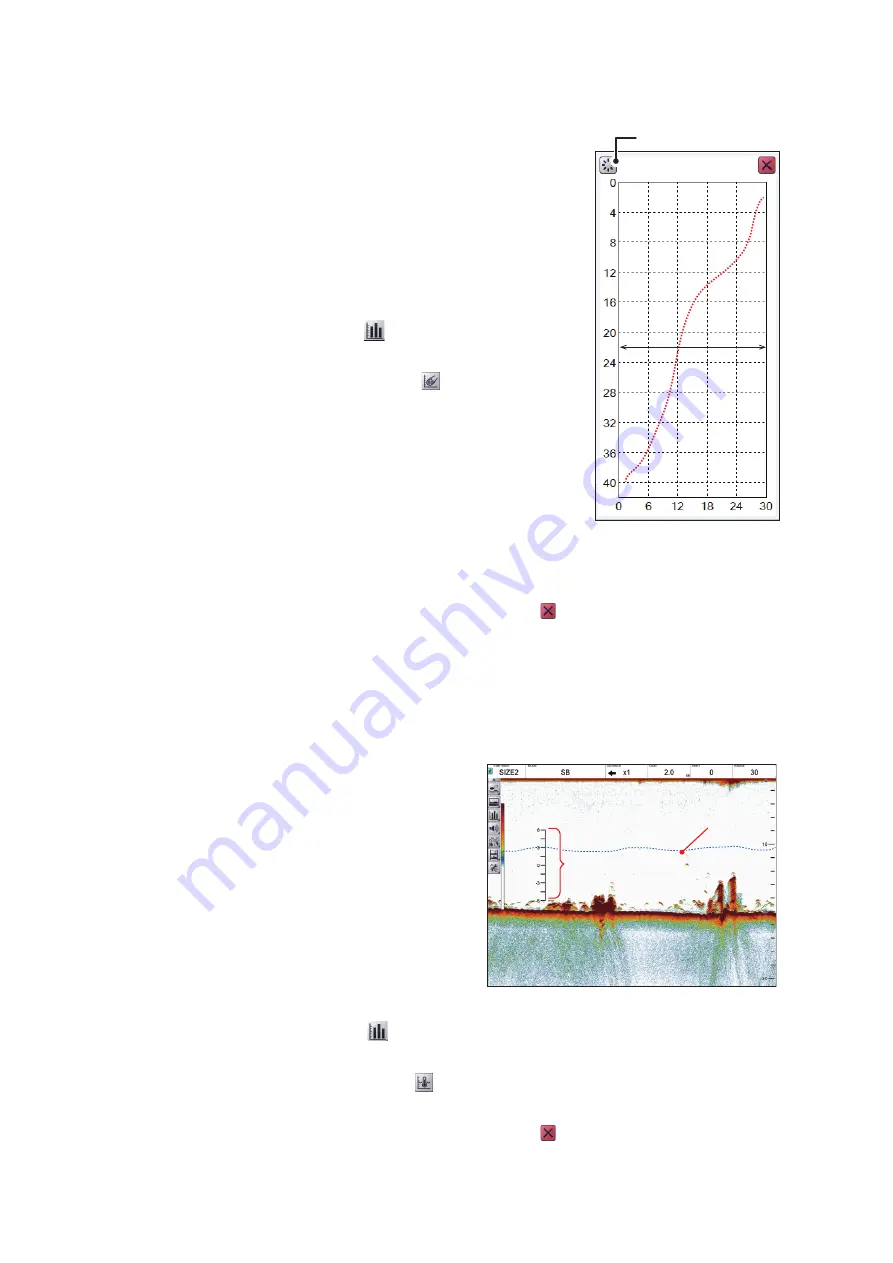
The [Sonde Graph] plots depth and water temperature
data, input from a net sonde, in the specified line color.
The data displayed is input from the net sonde with the
lowest number in the list of sondes selected at [Sonde
Mark] from the [Display] section of the [Advanced Set-
tings] menu. See section 4.3.
To show the [Sonde Graph], do the following:
1. Click the [Graph] icon (
) from the InstantAccess
bar™ to show the [Graph] menu.
2. Click the [Sonde Graph] icon (
). The icon
changes to a green color and the [Sonde Graph]
appears.
The depth and temperature at the sonde location
appears on the graph. The depth scale reflects any
changes to the fish finder depth scale.
The sonde graph window can be resized and moved
as necessary. Drag and edge of the window to resize
the graph. Drag and drop the window to change loca-
tion.
To close the graph, click the [Close Window] icon ( ), or click the graph icon.
Note:
You can clear the [Sonde Graph] and start a new graph at any time. Click the
[Refresh] button on the sonde graph to clear the graph and start a new graph.
2.5
Temp Graph
The [Temp Graph] plots water tempera-
ture using water temperature data, in a
blue dotted line across the screen.
Note 1:
Water temperature data is re-
quired to use this feature.
Note 2:
The data source for water tem-
perature input is set at installation. For de-
tails, consult your local dealer.
To show the [Temp Graph], do the follow-
ing:
1. Click the [Graph] icon (
) from the InstantAccess bar™ to show the [Graph]
menu.
2. Click the [Temp Graph] icon (
). The icon changes to a green color and the
[Temp Graph] appears.
To close the graph, click the [Close Window] icon ( ), or click the graph icon.
Horizontal axis: temperature
[Refresh] button
Vertical axis: depth
Display
range
Display
range
Water temperature graph
Water temperature graph
Graph scale
Graph scale


