


Cryo-con Model 24C
Basic Setup and Operation
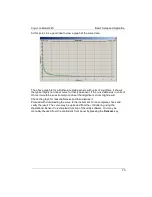
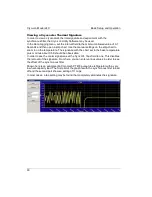
At this point, it is a good idea to view a graph of the curve data.
The above graph is for a Ruthenium-Oxide sensor with units of LogOhms. It shows
the typical highly non-linear curve for that type sensor. If the curve data was in units of
Ohms, it would be so extremely non-linear that significant errors might result.
Check the graph for reasonableness and then dismiss it.
Proceed with downloading the curve to the instrument. Once complete, check and
verify the result. The curve may be uploaded from the controller by using the
Operations>Sensor Curve>Upload function of the utility software. Or it may be
manually checked from the controller's front panel by pressing the
Sensors
key.
79


