Chapter VI Measurement System
51
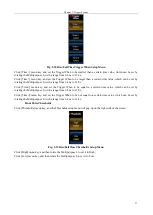
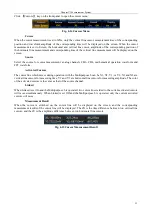
Fig. 6.11 Histograms Limits Setup Menu
The Top and Bottom Limits are the corresponding top and bottom voltage in the vertical direction of waveform in
the screen.
The Left and Right Limits are the corresponding left and right time in the horizontal direction of waveform in the
screen.
Display
Linearity: The histogram statistics are displayed in a linear relationship.
Log: The histogram statistics are displayed in a log relationship.
Reset Histogram Counts
Clear the current statistics of the histograms, and carry out statistics and count again.
6.1.4 Statistics
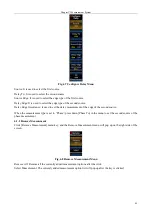
Click [Statistics] menu key, and the Statistics setup menu will pop up on the right side of the screen:
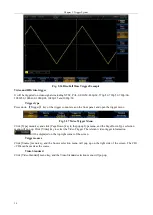
Fig. 6.12 Statistics Setup Menu
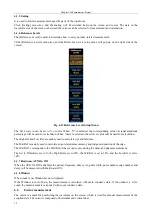
When the statistics are disabled, the measurement result window will only display the current measurement value.
When the statistics are enabled, besides the current measurement value, it will also display the average, min., max.
and standard difference.
Samples: It is used to set samples for statistics and count of average and standard difference. The adjustment range
is 2
1,000.
Reset Statistics: Clear the current statistics, and carry out statistics, count and calculation again.
Содержание 4456 Series
Страница 1: ...4456 Series Digital Phosphor Oscilloscope User Manual China Electronics Technology Instruments Co Ltd...
Страница 10: ...VIII...
Страница 55: ...Chapter V Trigger System 45 Fig 5 51 RF Test Signal Example...
Страница 69: ...Chapter VII Mathematical Operation 59 Fig 7 10 Advanced Math Example...
Страница 71: ...Chapter VIII Display System 61 Fig 8 3 Wfm Palette Menu Fig 8 4 Normal Palette...
Страница 72: ...Chapter VIII Display System 62 Fig 8 5 Inverted Palette Fig 8 6 Temperature Palette...
Страница 75: ...Chapter VIII Display System 65 Fig 8 12 XY Display Example...
Страница 165: ...Chapter XI Protocol Analyzer Option 155 Fig 11 242 1553 Trigger and Analysis Example...

