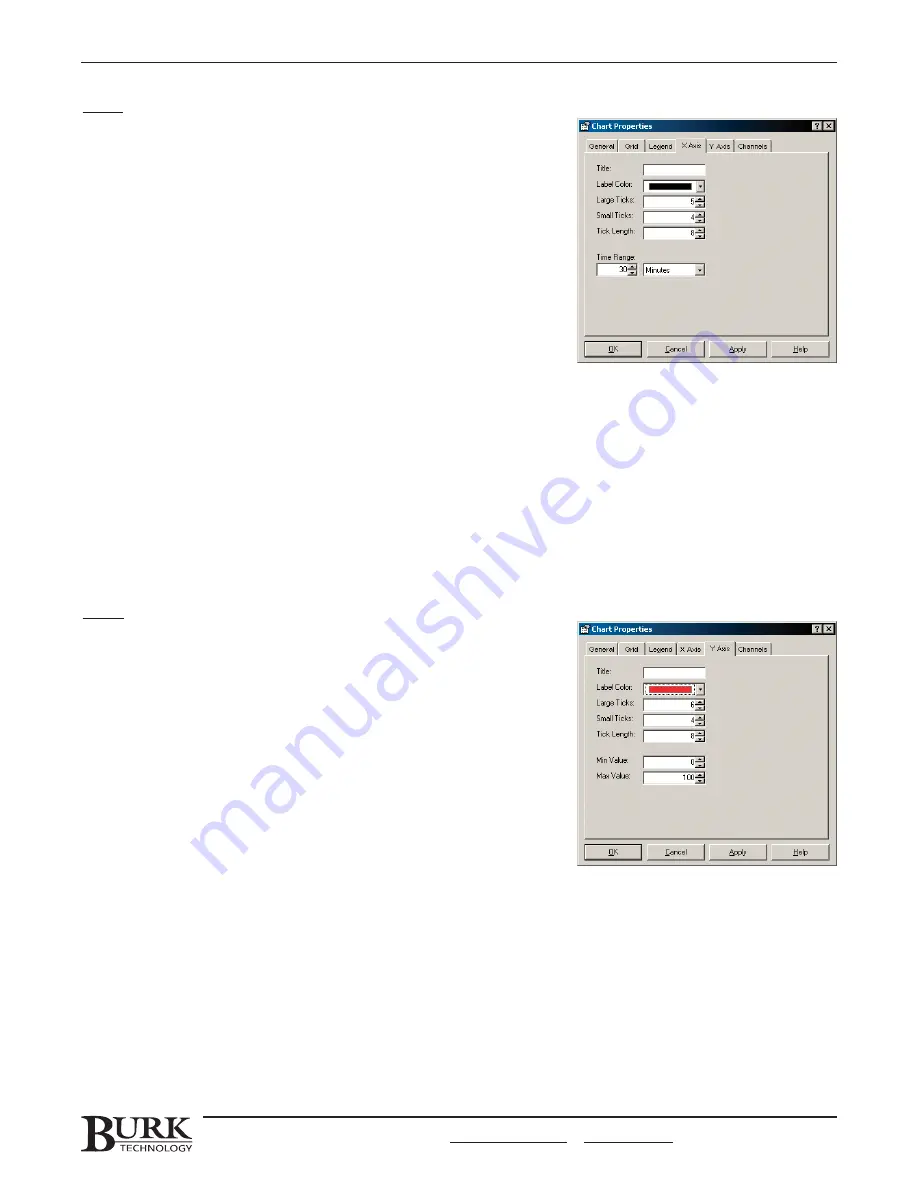
X-Axis
T
Tiittlle
e.. Choose a title for the X-axis (the horizontal row of values), or
leave it blank. The X-axis always represents time.
LLa
ab
be
ell C
Co
ollo
orr.. Choose a color for the X-axis title and value labels.
LLa
arrg
ge
e T
Tiicckkss.. Indicate how many large ticks you want dividing the
horizontal axis. Each large tick will generate a time readout on the
horizontal axis. The more ticks you have, the more time labels will be
displayed on your chart.
S
Sm
ma
allll T
Tiicckkss.. Choose the number of small ticks you want to divide each
large tick. Small ticks divide the large ticks into sections, but no times
are displayed under the small ticks.
T
Tiicckk LLe
en
ng
gtth
h.. Determine the length (in pixels) of the large ticks. Small ticks will appear in proportion to the large
ticks.
T
Tiim
me
e R
Ra
an
ng
ge
e.. Choose a time range for the chart. You can view data history over a span as short as a few seconds,
or up to 999 hours. In firmware version 5 and later, data is updated in real time, allowing highly responsive charts
with short time ranges (below thirty seconds). In firmware version 4, the frequency of data updates is
determined by the number of I/O units in the system. Time ranges below thirty seconds may not appear as
responsive.
Note: It is normal for the X-axis grid lines to become temporarily offset from the large ticks and time values at the
bottom of the chart. This is due to the rounding that occurs when the time interval is divided by the number of large
ticks.
Y-Axis
T
Tiittlle
e.. Enter a title for your Y-axis (the vertical axis). This title will usually
indicate what type of value is being charted (i.e. output power,
temperature, line voltage, etc.).
LLa
ab
be
ell C
Co
ollo
orr.. Enter a color for the text of your Y-axis title and the Y-axis
value labels.
LLa
arrg
ge
e T
Tiicckkss.. Indicate how many large ticks you would like to divide the
Y-axis. Each large tick will generate a value readout on the Y-axis.
S
Sm
ma
allll T
Tiicckkss.. Indicate the number of small ticks you want between each
large tick. Small ticks divide the large ticks into sections, but no value
label is shown for the small tick.
T
Tiicckk LLe
en
ng
gtth
h.. Determine the length (in pixels) of the large ticks. Small ticks will appear in proportion to the large
ticks.
M
Miin
n V
Va
allu
ue
e//M
Ma
axx V
Va
allu
ue
e.. The min and max values of the Y-axis determine the value range of the chart. Enter the
lowest and the highest values you want shown by the chart.
CHAPTER 7: SITE DATA & REPORTS
71
CUSTOMER SUPPORT: 978-486-3711 • [email protected] • www.burk.com
Содержание GSC3000
Страница 8: ...GSC3000 VRC2500 INSTALLATION OPERATION MANUAL viii ...
Страница 22: ...GSC3000 VRC2500 INSTALLATION OPERATION MANUAL 14 ...
Страница 32: ...GSC3000 VRC2500 INSTALLATION OPERATION MANUAL 24 ...
Страница 40: ...GSC3000 VRC2500 INSTALLATION OPERATION MANUAL 32 ...
Страница 52: ...GSC3000 VRC2500 INSTALLATION OPERATION MANUAL 44 ...
Страница 61: ...CHAPTER 6 MODEM SITE EQUIPMENT CONNECTIONS 53 CUSTOMER SUPPORT 978 486 3711 support burk com www burk com ...
Страница 68: ...GSC3000 VRC2500 INSTALLATION OPERATION MANUAL 60 ...
Страница 120: ...GSC3000 VRC2500 INSTALLATION OPERATION MANUAL 112 ...
Страница 128: ...GSC3000 VRC2500 INSTALLATION OPERATION MANUAL 120 ...
Страница 132: ...GSC3000 VRC2500 INSTALLATION OPERATION MANUAL 124 ...
Страница 140: ...GSC3000 VRC2500 INSTALLATION OPERATION MANUAL 132 ...
Страница 144: ...GSC3000 VRC2500 INSTALLATION OPERATION MANUAL 136 ...


