IMPORTANT!
Do not accept a spectral calibration until you examine the data for all
capillaries.
When a spectral calibration completes successfully, the Overall row displays green,
red, or yellow results.
For each capillary:
1.
Click a capillary to display the spectral and raw data for a capillary.
2.
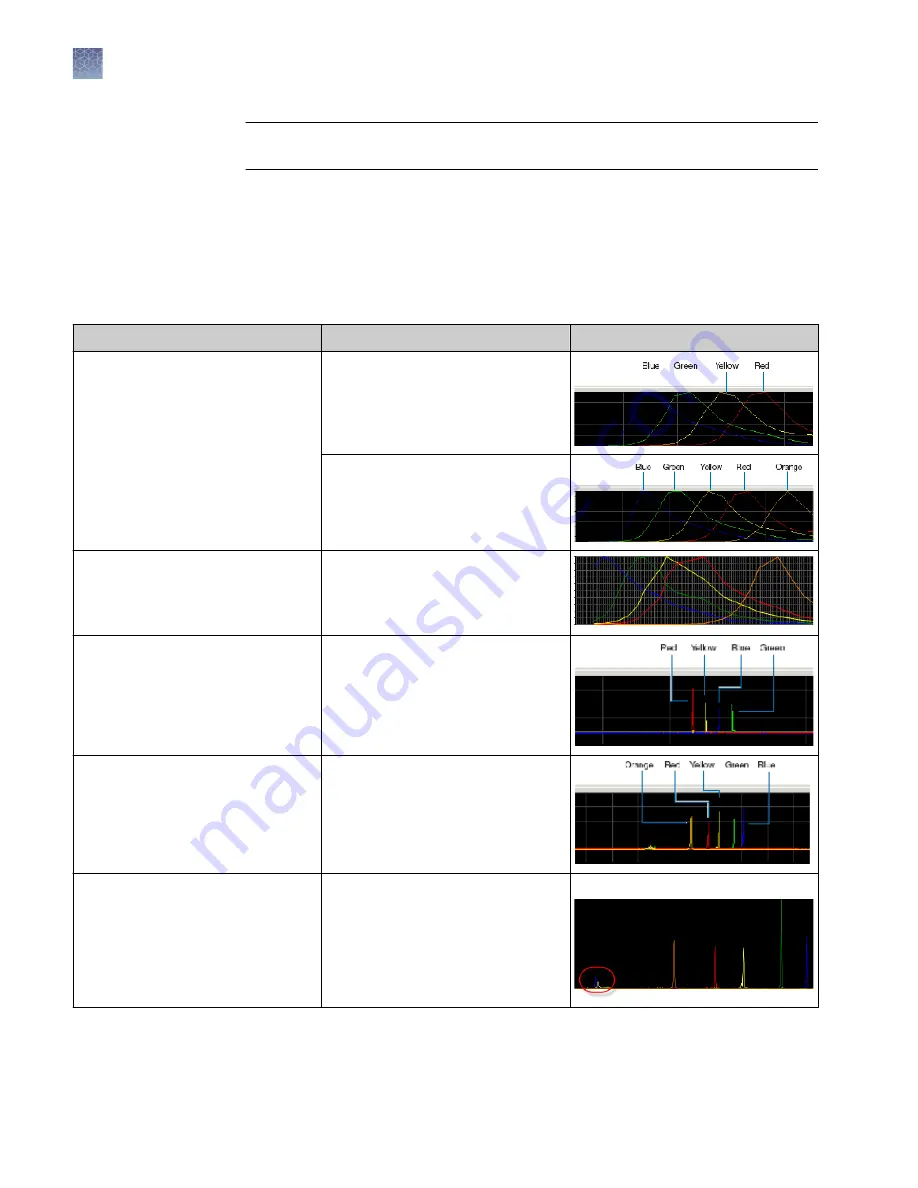
Check that the data meet the following criteria:
Attribute
Acceptance criteria
Example
Order of the peaks in the spectral
profile (intensity vs pixel) from left to
right
4-dye: blue-green-yellow-red
5-dye: blue-green-yellow-red-orange
6-dye: blue-green-yellow-red-purple-
orange
Order of the peaks in the raw data
profile from left to right
Sequencing (matrix standard only):
4-dye: red-yellow-blue-green
Order of the peaks in the raw data
profile from left to right
Fragment analysis:
• 4-dye: red-yellow-green-blue
• 5-dye: orange-red-yellow-green-
blue
Extraneous peaks in the raw data
profile (intensity vs scan)
None
Note:
The E5 profile may include
extraneous peaks outside the matrix
peak region, which can be ignored.
E5:
Evaluate the
spectral
calibration data
Chapter 6
Run calibrations and install checks
Run a spectral calibration
6
114
3500/3500xL Genetic Analyzer User Guide—Data Collection Software v3.1
Содержание 3500
Страница 325: ......
Страница 326: ...thermofisher com support thermofisher com askaquestion thermofisher com 25 October 2018 ...


