7. Maintenance
329
through the graphic display. Further information regarding the diagnostic key and its visualization
see One Touch Diag.
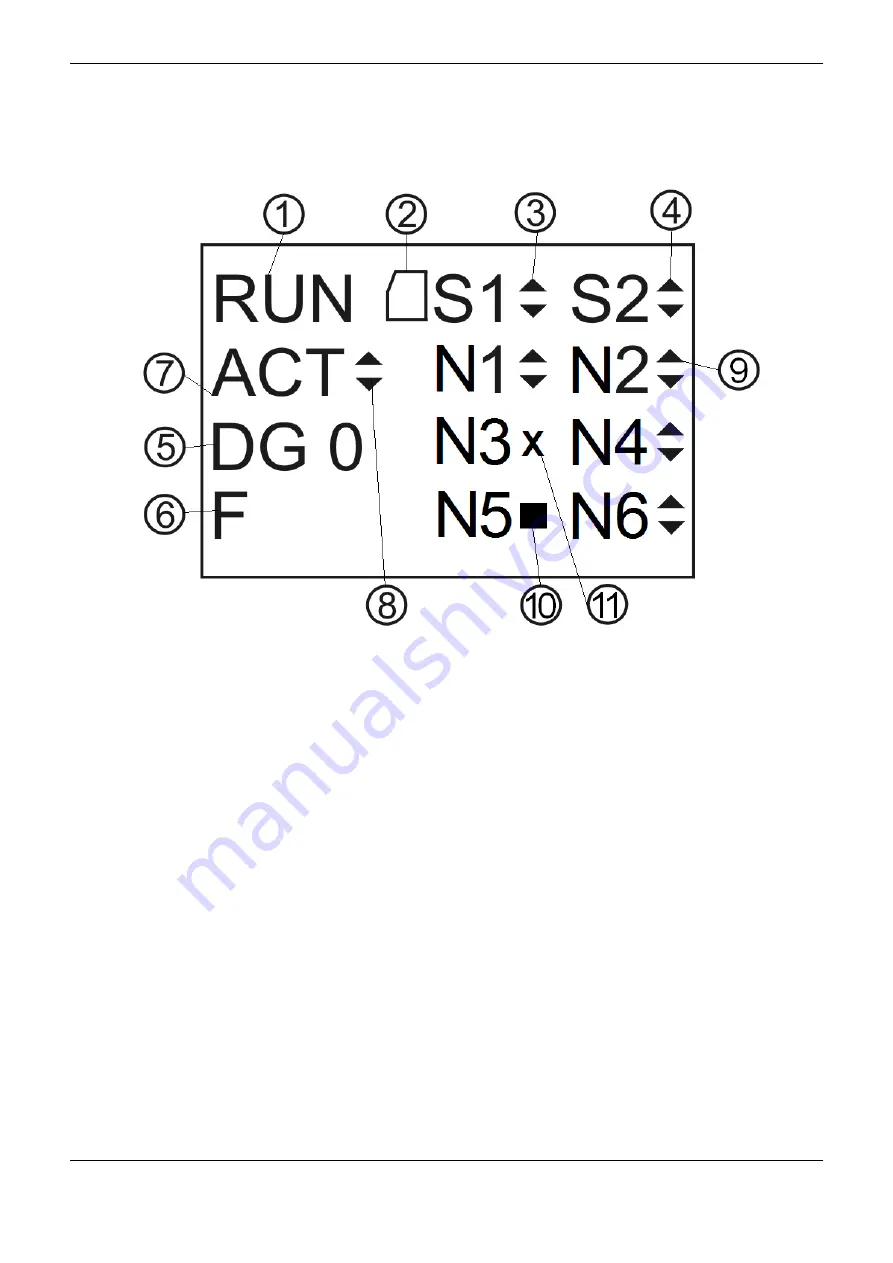
Figure 7-9 shows the available characters in the Hadron Xtorm CPU graphic display and their
respective meanings.
Figure 7-9. CPU HX3040 Status Screen
Legend:
1.
Indication of the CPU status operation: Run, Stop or BRKP whenever it is stopped on debugging
marks. Further details, see Run and Stop section.
2.
Indication of a memory card. Further details, see Installation.
3.
COM 1 traffic indication (S1). The up and down arrows (▲)(▼) indicate data transmission and
data reception respectively. Further information regarding the COM 1 interface, see Serial
Interfaces.
4.
COM 2 traffic indication (S2). The up and down arrows (▲)(▼) indicate data transmission and
data reception respectively. Further information regarding the COM 2, see Serial Interfaces
5.
Indication of the CPU active diagnostics amount. In case the number shown is different than 0
(zero), there are active diagnostics in the CPU. Further details regarding their visualization on the
CPU graphic display through diagnostic key, see One Touch Diag.
6.
Indication of forced variables in the CPU. In case the “F” character is shown in the graphic
display, a variable is being forced by the user, whether symbolic or direct representation. Further
information regarding variable forcing see Run.
7.
Identification of the CPU redundancy state (message only valid in HX3040 in redundant mode).
If the CPU is the active one, the ACT information will be presented. The other possible states are
NCF (Not-configured), STR (Starting), INA (Inactive) and SBY (Stand-by). For simple and
redundant CPU, the letters BRKP indicate Breakpoint.
8.
Indication that the project synchronization is being executed. The up arrow (▲) indicates project
data transmission and the down arrow (▼) indicates project data reception. For further
information about the project synchronization see Project Synchronization.


