145
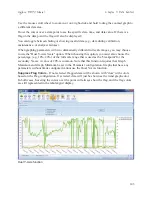
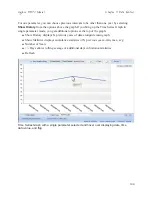
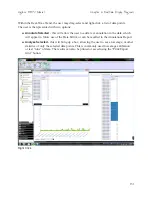
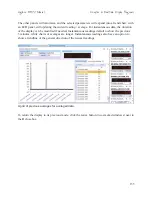
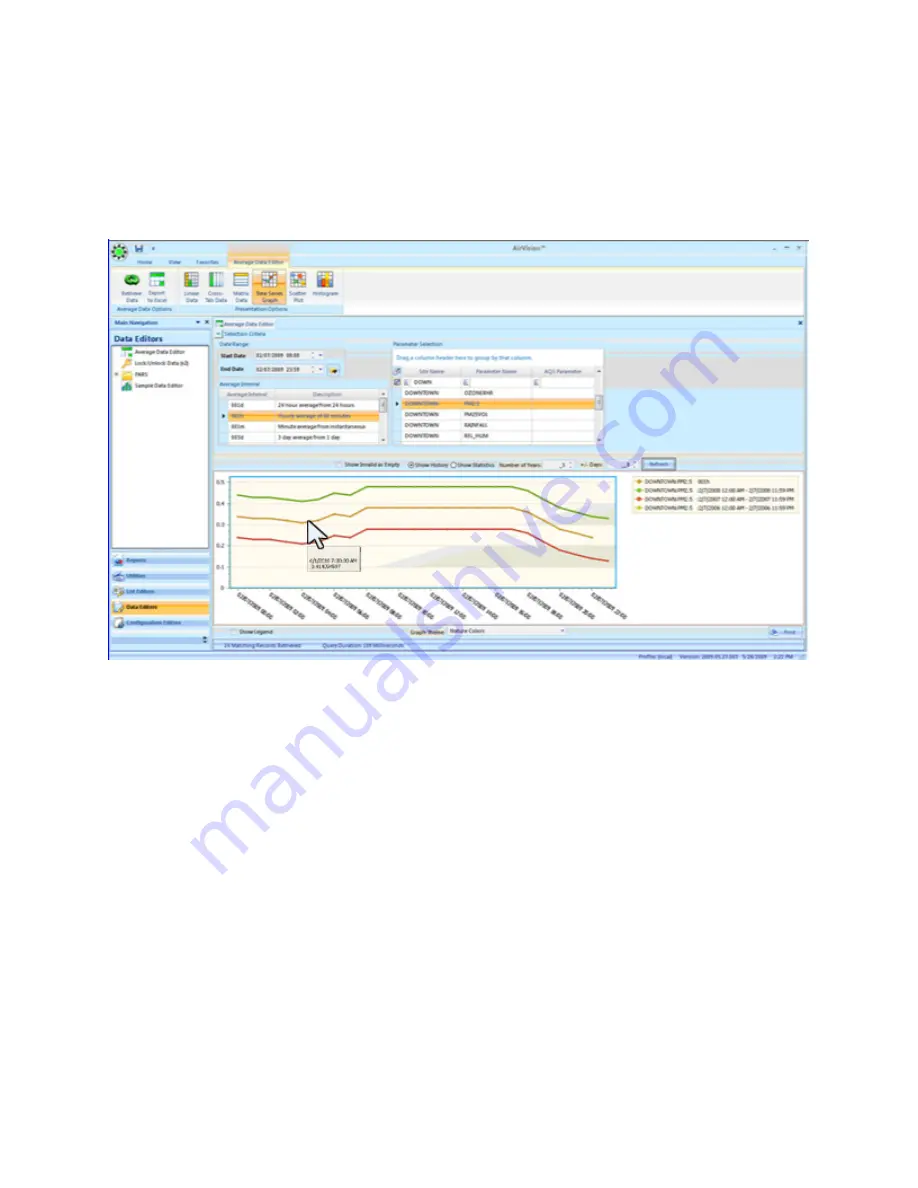
If the database contains data from previous years for the same parameter, those previous years
can be graphed in the Time Series Graph alongside the current data by selecting
Show History
and the number of years you want to graph. Each previous year is graphed individually.
Select
Refresh
to update the graph.
Agilaire 8872 Manual
Chapter 5 Data Editors
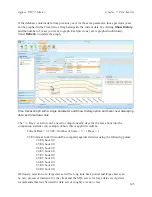
Time Series Graph with a single parameter and Show History option and hover over displaying
date, and time data value
The “+/- Days” selector can be used to compile nearby days for the same hour into the
comparison statistics. An example of how this is applied would be:
Current Data = 1/15/09,. Number of Years = 3, +/- Days = 1
1/5/09 data at hour 00 would be compared against statistics using the following points:
1/4/06, hour 00
1/5/06, hour 00
1/6/06, hour 00
1/4/07, hour 00
1/5/07, hour 00
1/6/07, hour 00
1/4/08, hour 00
1/5/08, hour 00
1/6/08, hour 00
Obviously, selection of a large data set with a long look back period and large skews can
be very processor intensive for the client and the SQL server for large data sets. Agilaire
recommends this tool be used for data sets of roughly a week or less.

