142
Agilaire 8872 Manual
Chapter 5 Data Editors
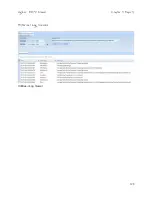
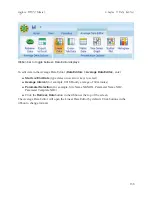
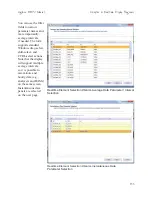
Matrix Data Editor from Data Editors menu
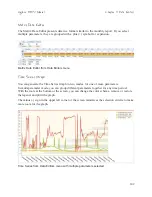
Matrix Data Editor
The Matrix Data Editor presents data in a format similar to the monthly report. If you select
multiple parameters, they are grouped with a plus (+) symbol for expansion.
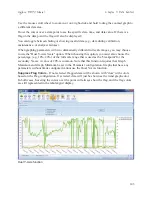
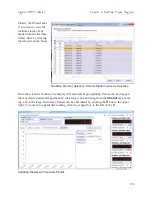
Time Series Graph
You can generate the Time Series Graph in two modes, for one or more parameters.
In multi-parameter mode, you can group different parameters together for any time period.
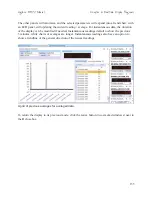
With the tools at the bottom or the screen, you can change the color scheme, remove or restore
the legend, and print the graph.
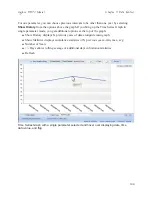
The minus (-) sign in the upper left corner of the screen minimizes the selection criteria to make
more room for the graph.
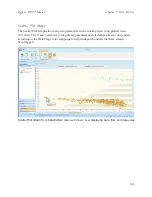
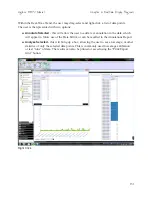
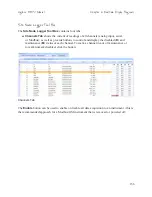
Time Series from Data Editors menu with multiple parameters selected

