background image

5-4

IM DLM3054-01EN

Creating a Rectangular Zone (RectZone)

To create a rectangle, use the jog shuttle or the SET key to set the top, bottom, right, and left boundaries of the 
rectangle.

When the NO-GO determination condition is set to IN 

and the waveform enters the specified rectangular 

zone, a no-go judgment is made.

Creating a Rectangular Zone (Upper/Lower and Left/Right)

Create a rectangular zone.
•  The selectable range for top and bottom boundaries is ±4 divisions from the screen center in 0.01-division 

steps.

•  The selectable range for left and right boundaries is ±5 divisions from the screen center in 0.01-division steps.

Determination Source Window (Range)

If the source waveform is CH1 to CH4, Math1 to Math4, set the GO/NO-GO determination source window to one 
of the following options:
•  Main: Main window
•  Zoom1: Zoom1 window
•  Zoom2: Zoom2 window

  Rectangular zone does not appear when the determination source waveform display is set to off.

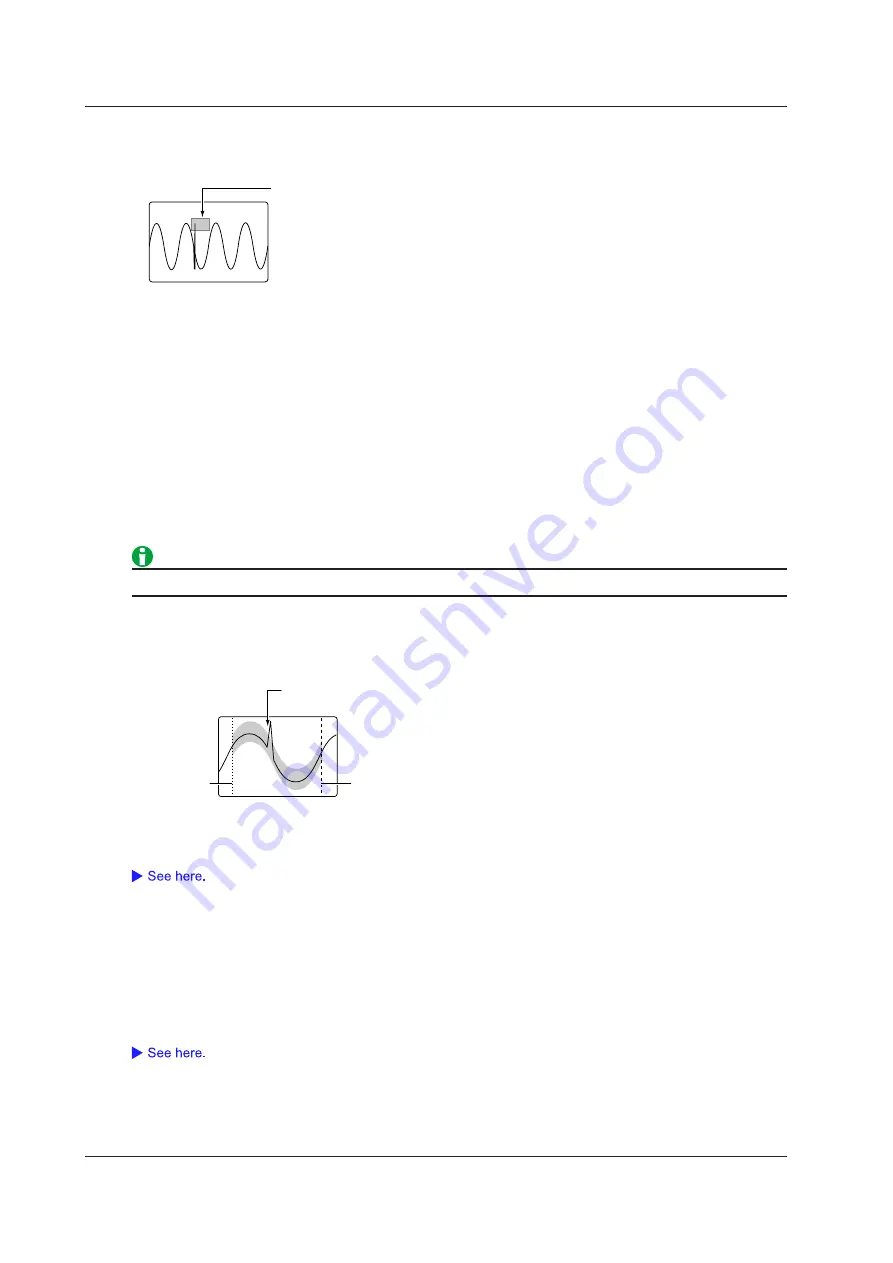
Creating a Waveform Zone (WaveZone)

Create a zone based on the source waveform. You can also use other waveforms to create the zone.1 You can 
create up to four waveform zones. One of them is used for GO/NO-GO determination.

T Range2

T Range1

When the NO-GO determination condition is set to OUT, 

a no-go judgment is made here.

Determination Source Window (Range)

Select the GO/NO-GO determination source window. The selection process is the same as with the rectangular 
zone.

Selecting the Waveform Zone (Zone No.)

Select the number of the waveform zone you want to edit. GO/NO-GO determination is performed using the 
waveform zone that you select here.

Editing a Waveform Zone (Edit1 to 4)

Create a vertical or horizontal zone on the entire waveform or on a portion of the waveform.
The waveform zones that you create are stored in the internal memory even when the power is turned off. You 
can save and load waveform zones from the internal storage or an external storage device using the FILE menu.

5  Executing Actions

Summary of Contents for DLM3022

Page 1: ...IM DLM3054 01EN 1st Edition Features Guide Mixed Signal Oscilloscope DLM3024 DLM3034 DLM3054 Digital Oscilloscope DLM3022 DLM3032 DLM3052 nbn Austria GmbH ...

Page 2: ...er should you have any questions or find any errors please contact your nearest YOKOGAWA dealer Copying or reproducing all or any part of the contents of this manual without the permission of YOKOGAWA is strictly prohibited The TCP IP software of this product and the documents concerning it have been developed created by YOKOGAWA based on the BSD Networking Software Release 1 that has been license...

Page 3: ...IM DLM3054 04EN Provided as a printed manual Explains the basic operations of this instrument Operations are described in steps from Preparation to Displaying Waveforms Measuring Waveforms and Saving Screen Captures DLM3022 DLM3032 DLM3052 Digital oscilloscope DLM3024 DLM3034 DLM3054 Mixed Signal Oscilloscope Communication Interface User s Manual IM DLM3054 17EN The supplied CD contains the PDF fi...

Page 4: ...osition POSITION knob 2 1 Setting the Bits Bit Setup 2 1 Bus Display Bus 2 3 State Display State 2 4 Setting the Display Order of Bits and the Bus Bit Order 2 5 Deskew Deskew 2 5 3 Horizontal Axis Time Axis Time Scale TIME DIV knob 3 1 4 Triggering Trigger mode Trigger Mode 4 1 Trigger Type Type 4 2 Signal Type and Trigger Type Combinations 4 3 Basic Trigger Settings 4 4 Edge Trigger EDGE 4 4 Edge...

Page 5: ...gger or GO NO GO determination Exec 5 3 GO NO GO Determination Go Nogo AND Go Nogo OR 5 3 Notes about Action 5 7 6 Waveform Acquisition Record length Record Length 6 1 Acquisition mode Mode 6 2 High Resolution Mode Hi Resolution 6 3 Sampling Mode Sampling Mode 6 4 Waveform Acquisition RUN STOP 6 5 Acquiring the Waveform Once SINGLE 6 5 7 Display Types of Windows 7 1 Display Format Format 7 1 Displ...

Page 6: ...4 Cursor Measurement Measure Setup 10 4 11 Cursor Measurement Turning Cursor Measurement On and Off Display 11 1 Cursor Mode Type 11 1 Measurement Source Waveform Trace 11 1 ΔT Cursors ΔT 11 2 ΔV Cursors ΔV 11 2 ΔT ΔV Cursors ΔT ΔV 11 3 Marker Cursors Marker 11 3 Angle Cursors Degree 11 4 Moving the Cursors Cursor Marker 11 4 Cursor Jumping Cursor Jump T Cursor Jump 11 5 12 Automated Measurement o...

Page 7: ...al Bus Signals Turning the Analysis and Search Feature On or Off Display 15 1 Serial Bus Signal Type Type 15 2 Bus Setup Setup 15 2 Search Setup Search 15 2 Zoom Position Z1 Position Z2 Position 15 3 Decoded Display Decode 15 3 List Display List 15 4 Trend Display Trend 15 4 Saving the Analysis Results 15 4 Analyzing and Searching FlexRay Bus Signals Option 15 5 Analyzing and Searching CAN Bus Sig...

Page 8: ... Display Range Start End No 18 2 List of Timestamps List 18 2 Searching History Waveforms Search 18 3 Replay Replay 18 4 Notes on Using the History Feature 18 4 19 Printing and Saving Screen Captures Destination Type Print To 19 1 Printing on the Built in Printer BuiltIn Option 19 2 Printing on a USB Printer USB 19 2 Printing on a Network Printer Network 19 4 Saving Screen Captures to Files File 1...

Page 9: ...ion 22 3 Remote Control Remote Control 22 4 System Configuration System Configuration 22 6 Overview Overview 22 9 Self Test Self Test 22 10 Touch Panel TOUCH 22 10 Appendix Appendix 1 How to Calculate the Area of a Waveform App 1 Appendix 2 User Defined Computation App 3 FFT Function App 7 Appendix 3 ASCII Data File Format App 10 Appendix 4 TCP and UDP Port Numbers App 11 Appendix 5 How Power Meas...

Page 10: ...m is shown OFF The waveform is hidden Vertical Scale SCALE knob The vertical scale is used to adjust the displayed waveform amplitude so that you can easily view signals Set the vertical scale by voltage per grid square V div or current per grid square A div on the screen Set the vertical scale using the SCALE knob for each channel The SCALE knob is shared between channels Press the CH1 to CH4 key...

Page 11: ... they do not overlap without dividing the screen the resolution of the A D converter cannot be used to its fullest potential To make accurate measurements divide the screen and set the vertical scale of each waveform to a high value Waveform Vertical Position POSITION knob You can move the display position vertical position of each waveform in the range of 4 divisions The vertical scale changes wi...

Page 12: ...ligned with the probe attenuation so that the voltage current and scale values are displayed correctly Set the attenuation ratio to match the probe attenuation Probe Type Type Select the type of probe to set the attenuation ratio of Voltage Voltage probe Current Current probe Attenuation Ratio Attenuation Select the attenuation ratio from the following Voltage probe 0 001 1 0 002 1 0 005 1 0 01 1 ...

Page 13: ...UT circuitry Deskew Deskew You can adjust for the time offsets skew between the CH1 to CH4 signals which are caused by the use of different types of probes and monitor the signals You can adjust each channels CH1 to CH4 separately Selectable range 1000 0 ns to 1000 0 ns 0 01 ns resolution Inverted Waveform Display Invert Waveforms can be inverted across the waveform vertical position Only the disp...

Page 14: ... 10 MHz 5 MHz 2 MHz 1 MHz 500 kHz 250 kHz 125 kHz 62 5 kHz 32 kHz 16 kHz 8 kHz When high resolution mode is on the bandwidth limit is set at 200 MHz even when bandwidth limit is set to FULL Offset Offset If you set an offset when measuring an analog signal that is riding on top of a given voltage or current the given voltage or current is subtracted from the input signal This allows you to only vi...

Page 15: ...surements are performed The vertical position on the screen corresponds to the offset 1 00 V div Offset 0 00 V Position 0 00 div 1 00 V div Offset 2 00 V Position 0 00 div 0 500 V div Offset 2 00 V Position 0 00 div When Offset Cancel is set OFF When Offset Cancel is set ON Vertical position mark Ground level mark The offset setting applies to all input coupling settings AC DC DC50 If you change t...

Page 16: ...o one of three levels Press LOGIC and use the SCALE knob to set the range while the key is illuminated Vertical Position POSITION knob You can move the logic signal s vertical display position within 4 divisions Press LOGIC and use the POSITION knob to set the position while the key is illuminated Setting the Bits Bit Setup For each bit you can turn on or off the display set the label name and thr...

Page 17: ... each bit All Set the threshold level of all bits to the same value Each Set the threshold level for each bit When you connect one of the following logic probes to the instrument Threshold Type is set automatically Model 701988 Fixed to All The setup menu does not appear Model 701989 Each select All or Each Noise Rejection Noise Rejection When the 701989 logic probe is connected you can apply hyst...

Page 18: ...play Hex Bus Bit Assignments Assignment Set which bits to assign to the bits on the bus from the MSB to LSB The bit assignments here are used to measure the bus value during cursor measurement Edit Menu In the assignment edit menu you can select a position in the bus to assign a bit delete an assigned bit and so on Bits Select the bit to assign from the group of bits Label Name Set the label that ...

Page 19: ...e Unknown area Clock Source Clock Select from the following CH1 to CH3 LOGIC Bit0 to Bit7 Clock Source Polarity Polarity Select the clock source polarity When the clock source changes from low to high When the clock source changes from high to low When the clock source changes from low to high or from high to low Detection Level Threshold Set the level for detecting edges Set this when the clock s...

Page 20: ...Order of Bits and the Bus Bit Order Set the vertical display order of bits and the bus on the screen Select the bit or bus to move and then specify the destination Deskew Deskew You can adjust for the time offsets skew between the logic signal and other signals which are caused by the use of different types of probes to measure signals Deskewing of the logic signal is performed on all eight bits c...

Page 21: ...ime scale the record length is reduced Sample rate Record length time scale s div 10 div When you change the time scale the sample rate and the record length stored in the acquisition memory also change For details see appendix 1 Relationship between the Time Scale Record Length and Sample Rate in the Getting Started Guide IM DLM3054 03EN Time Scale and Roll Mode Display When the following conditi...

Page 22: ...at waveform acquisition operates in single mode computed waveforms MATH waveforms nor automated measurement values of waveform parameters are not shown while waveform acquisition is in progress Waveforms and computed values are shown when a trigger occurs and the roll mode display stops The record length that causes waveform acquisition to operate in single mode varies depending on whether a memor...

Page 23: ...s set to a value that would cause the display to switch to roll mode roll mode display will be enabled Normal Mode Normal The instrument updates the waveform display only when the trigger conditions are met If no triggers occur the display is not updated If you want to view waveforms that the instrument cannot trigger on or if you want to check the ground level use Auto mode N Single Mode N Single...

Page 24: ...e Window OR trigger Triggers on the OR logic of multiple trigger sources entering or exiting from each specified range window Interval trigger Triggers when the time condition of the signal period is met Serial trigger FlexRay CAN CAN FD LIN CXPI SENT UART I2C SPI User Define Triggers on various serial bus signal conditions TV trigger NTSC PAL SDTV HDTV UserdefTV Triggers on various TV signal cond...

Page 25: ...indow OR Yes No No Interval Yes Yes Serial FlexRay Yes No CAN Yes No CAN FD Yes No LIN Yes No CXPI Yes No SENT Yes Yes UART Yes Yes I2C Yes Yes Yes SPI Yes Yes Yes User Define Yes No No TV Yes No CH4 and LOGIC cannot be used simultaneously in waveform display measurement analysis or search but they can be used simultaneously as trigger sources in triggering When the maximum record length is in use...

Page 26: ... is set to rising Trigger source Trigger Source Source Trigger source refers to the signal used to determine whether the specified trigger conditions are met Select from the following CH1 to CH4 A signal that is received through front panel input terminals 1 to 4 the number of input terminals varies depending on the model LOGIC On models with the logic signal input port A signal that is received t...

Page 27: ... levels upper level and lower level and that of the other has one level the center value of the two levels and the single level are shared The selectable range of threshold levels used to detect logic signal bit states is the same as the selectable range of the source bit trigger level How you can set the bit levels varies depending on the logic probe that you are using Model 701988 The level sett...

Page 28: ...s do not change as long as the signal level changes within that range If the 701989 logic probe is connected select the hysteresis from one of the following settings below Hysteresis of approximately 100 mV around the threshold level Hysteresis of approximately 250 mV around the threshold level The above values are approximate values They are not strictly warranted The hysteresis is fixed at appro...

Page 29: ... the trigger point Mark that indicates the trigger position Delay Cancel Delay Cancel You can select whether or not to apply the specified delay to the time measurement values The default setting is ON ON Measures time values by setting the trigger position to 0 s the delay is not applied to time measurement values OFF Measures time values by setting the trigger point to 0 s the delay is applied t...

Page 30: ...CH1 Trigger Trigger CH2 Trigger Source CH1 CH2 CH3 CH4 Set the trigger slope for each channel There is also a feature All soft key for applying the same settings to CH1 to CH4 When the trigger source changes from a level below the trigger level to a level above the trigger level rising When the trigger source changes from a level above the trigger level to a level below the trigger level falling W...

Page 31: ...tion Clock source CH3 Pattern CH1 H CH2 L other channels X Logic AND Condition Enter Not met Not met Not met Not met Met Met CH1 CH2 Trigger CH3 L H H CH1 CH2 H H L L L Results of comparisons that have been sampled using the clock Comparison with the specified pattern Example 2 When the result of comparing the combination Logic of the trigger source signal pattern Pattern and the specified pattern...

Page 32: ...son with the specified pattern Example 2 The instrument triggers when the relationship between the duration the result Enter or Exit of the trigger condition Condition of comparing the combination Logic of the trigger source signal pattern Pattern and the reference time meets the specified time condition Time Qualification When the time condition is set to timeout the instrument triggers when a ti...

Page 33: ...k Source Clock Select the clock source from the following The selectable settings vary depending on the model If you select LOGIC set the source bit CH1 to CH4 LOGIC Bit0 to Bit7 None not specify a clock source Clock Source Slope Select the clock source slope When the source changes from a level below the specified level to a level above the specified level rising When the source changes from a le...

Page 34: ...riggers at the point of change True Detects matches in the comparison conditions The trigger timing varies depending on time conditions explained later False Detects mismatches in the comparison conditions The trigger timing varies depending on time conditions explained later Time Condition Time Qualification Set what kind of relationship must be established between the trigger condition achieveme...

Page 35: ...Configure the polarity HF rejection noise rejection and trigger level settings for the selected trigger source Polarity Polarity Select which trigger source polarity will cause the comparison of the pulse width with the reference times The trigger source polarity is based on the trigger level When the signal level is high When the signal level is low Time Condition Time Qualification Set what kind...

Page 36: ...mes and the specified reference times meets the selected time condition Upper Level Lower Level Trigger when set to Trigger when set to Trigger source Example Upper Level Lower Level CH1 Source CH1 Time Qualification Less than t Time Time Trigger t Trigger Source Source Select the trigger source from the following CH1 to CH4 The selectable settings vary depending on the model Configure the polarit...

Page 37: ...me or Time1 and Time2 The selectable range for Time or Time1 and Time2 varies depending on the time condition More than Time 2 ns to 10 s Less than Time 4 ns to 10 s Inside Time1 2 ns to 10 s 2 ns Time2 4 ns to 10 s Outside Time1 2 ns to 10 s 2 ns Time2 4 ns to 10 s Resolution 2 ns Reference Range Upper Level Lower Level Set the upper and lower levels of the reference range HF Rejection HF Rejecti...

Page 38: ...rence times The trigger source polarity is based on the trigger level When the trigger source is Pos positive polarity When the trigger source is Neg negative polarity When the trigger source is Pos positive polarity or Neg negative polarity Time Condition Time Qualification Set what kind of relationship must be established between the trigger source s pulse width and the specified reference times...

Page 39: ...re the end edge of a pulse Example CH1 Trigger Time Trigger Time Level Trigger source CH1 Both Trigger Source Source Select the trigger source from the following CH1 to CH4 or LOGIC The selectable settings vary depending on the model If you set the trigger source to LOGIC set the source bit Configure the polarity HF rejection noise rejection and trigger level settings for the selected trigger sour...

Page 40: ... time meets the selected time condition When the time condition is timeout the instrument triggers when a timeout occurs Window OUT IN OUT Upper Level Lower Level Example CH1 Upper Level Lower Level Source CH1 Polarity Time Qualification Less than t Time Time Trigger t Trigger Source Source Select the trigger source from the following CH1 to CH4 The selectable settings vary depending on the model ...

Page 41: ...ays inside or outside the window is shorter than reference time Time1 or longer than reference time Time2 Timeout When the time that the waveform stays inside or outside the window is longer than the specified reference time Time Reference Times Time or Time1 and Time2 The selectable range for Time or Time1 and Time2 varies depending on the time condition More than Time 2 ns to 10 s Less than Time...

Page 42: ...ecome trigger sources Polarity Select the polarity from the following When the trigger source level enters the specified voltage span window When the trigger source level goes outside of the specified voltage span window Trigger Levels Levels Set the range HF rejection noise rejection trigger position trigger delay and trigger hold off Range Upper Level Lower Level Set the upper and lower levels o...

Page 43: ...lationship must be established between the trigger source s period and the specified reference times Time Time1 and Time2 for the instrument to trigger More than The period must be longer than the specified reference time Time Less than The period must be shorter than the specified reference time Time Inside The period must be longer than reference time Time1 and shorter than reference time Time2 ...

Page 44: ...perly if the spacing between signals or the time detection width is less than 1 ns Under standard operating conditions the time accuracy immediately after calibration is as follows CH1 to CH4 0 002 of setting 450 ps LOGIC 0 002 of setting 1 ns 4 Triggering ...

Page 45: ...trigger is used to capture CAN FD bus signals CAN FD is an abbreviation for CAN with Flexible Data Rate It is based on CAN and supports high speed data phase transfer rates The length of data that can be embedded in a single Data Field is expanded to up to 64 bytes and the CRC generator polynomial is also expanded As with CAN symbolic triggering is possible LIN bus trigger The LIN bus trigger is u...

Page 46: ...n automatically configure the bit rate and source level settings and then trigger based on those settings The auto setup feature will not work properly on some input signals This feature is in the serial bus signal search feature FlexRay Bus Trigger ENHANCED option The instrument triggers based on the trigger conditions of a particular frame or type of data in a FlexRay bus signal Frame ID Payload...

Page 47: ...start of FlexRay bus signal frames Frame Start of ID Data is always selected as a trigger condition Indicator You can use the states of four indicators as trigger conditions The Indicator trigger condition is met when the input signal Indicator bit pattern matches the specified bit pattern Bit Pattern Indicator Setup Select the bit patterns of the four indicators from one of the following settings...

Page 48: ...on The comparison conditions are the same as those listed for Frame ID You can set the reference values within the range of 0 to 63 Data1 Data2 You can use the value of up to 8 consecutive bytes of data from Data 0 to Data 253 as a trigger condition Data Length Size Set how many consecutive data bytes of the payload segment will be compared Selectable range 1 to 8 bytes Comparison Start Position P...

Page 49: ...d bit position which are determined by the Size and MSB LSB settings respectively The value is displayed in scientific notation when the number of digits exceed seven example 1234567E 10 Byte Order Endian Set the data byte order to big endian Big or little endian Little Sign Sign Set whether to use a signed Sign or unsigned Unsign data format The selectable range of data reference values varies de...

Page 50: ...ue that fits within the 8 divisions of the screen For example when the voltage scale is 200 mV division you can set the trigger level in 2 mV steps You can reset the trigger level to the current offset voltage by pressing RESET Hysteresis Hysteresis FlexRay signal input Trigger level Trigger hysteresis Data_1 Data_0 Data_0 Idle Trigger comparator output Data_0 Bit Rate Bit Rate Select the FlexRay ...

Page 51: ...ame Triggers here 8 bits 8 bits BSS BSS FES Error mode When there is a CRC error in the header When there is an FES error Triggers here Triggers here Triggers here Approx 2 bits 8 bits 8 bits BSS BSS BSS When there is a BSS error Triggers here Approx 2 bits Example Error at 00 Example Error at 00 ID Data mode Trigger Frame ID Payload Length Header CRC Cycle Count Data 0 Data 1 Data 2 Data n CRC CR...

Page 52: ... 0 Voted data Sampling counter CAN Bus Trigger ENHANCED option The instrument triggers based on the trigger conditions of a particular frame or type of data in a CAN bus signal 1 11 1 1 1 4 15 8N 0 N 8 1 1 1 ID 10 0 Arbitration Field Control Field Data Field CRC Field ACK CAN Data Frame Standard DLC 3 0 CRC Sequence Data 7 EOF Recessive Dominant SOF RTR IDE r0 ACK Delimiter ACK slot CRC Delimiter ...

Page 53: ... Input Format Input format Select the ID input format from one of the settings below Pattern Set the bit pattern of each ID in hexadecimal or binary notation Message Select this setting to set the ID or Data trigger conditions by using messages and signals that are defined in the symbol definition file sbl Bit Pattern Hex Bin Set the 11 bit standard format ID bit pattern or the 29 bit extended for...

Page 54: ... and comparison range MSB or LSB The selectable ranges are as follows Unsigned Unsign 0 to 9E 18 The selectable maximum value is limited by the data length and bit position which are determined by the DLC and MSB LSB settings respectively Signed Sign 9E 18 to 9E 18 The selectable minimum and maximum values are limited by the data length and bit position which are determined by the DLC and MSB LSB ...

Page 55: ...nd symbols in the physical value symbol definition file sbl that has been loaded into the instrument can be used to set the trigger condition Messages and signals can be used when the ID input format is set to Message Physical value symbol definition files sbl are derived by converting CANdb files dbc Message Select the ID from the Message list in the sbl file that has been loaded The message trig...

Page 56: ...essage Select this setting to set the ID trigger conditions by using messages that are defined in the symbol definition file sbl ID1 to ID4 You can set up to four IDs IDs whose check boxes are selected are used as trigger conditions The ID trigger condition is met when the input signal ID bit pattern matches any of the specified ID bit patterns The method for setting the bit pattern of each ID is ...

Page 57: ...s than the dominant level Sample Point Sample Point You can set the reference that will be used to determine the bus level recessive or dominant in the range of 18 8 to 90 6 in 3 1 steps The instrument s CAN bus signal trigger circuit samples the input CAN bus signal using the internal clock and detects the point of change from recessive to dominant Set the sample point as a percentage with the de...

Page 58: ...R IDE ACK Delimiter ACK Slot CRC Delimiter RTR r0 r1 Positions 1 to 6 above are trigger points for the following conditions 1 SOF 2 ID 3 Data Frame when DLC 0 4 Data Frame when DLC 0 5 CRC Error 6 ACK Remote Frame Remote Frame Standard format 1 11 1 1 1 4 15 1 1 1 ID 10 0 Arbitration Field Control Field CRC Field ACK Remote Frame DLC 3 0 CRC Sequence 7 EOF 1 2 3 5 4 Recessive Dominant SOF RTR IDE ...

Page 59: ...e time axis High speed CAN ISO11898 and Low speed CAN ISO11519 2 The primary standards for the CAN physical layer are High speed CAN ISO11898 and Low speed CAN ISO11519 2 As shown in the following figure the bus level is determined by the potential difference between two buses CAN_High and CAN_Low in either standard 0 1 2 3 4 5 Bus level V CAN_High CAN_Low Node n Max 30 Node 1 High speed CAN ISO11...

Page 60: ...and Data pattern ID OR Triggers on the OR of multiple ID bit patterns FDF Triggers on the FDF bit state ESI ErrorPassive Triggers when the ESI bit is recessive error passive SOF Start of Frame The instrument triggers on the start of CAN FD bus signal frames Error The instrument triggers on an error when the error flag is active or when it detects various errors CAN FD Standard FD Standard Select t...

Page 61: ...adecimal or binary notation Message Select this setting to set the ID or Data trigger conditions by using messages and signals that are defined in the symbol definition file sbl Bit Pattern Hex Bin Set the 11 bit standard format ID bit pattern or the 29 bit extended format ID bit pattern in hexadecimal Hex or binary Bin notation The ID trigger condition is met when the input signal ID bit pattern ...

Page 62: ...e set the data pattern for the specified data size in hexadecimal Hex or binary Bin notation Reference Values a and b If the comparison condition is set to Data A Data a a Data Data b a Data b or Data a or b Data set the reference values in decimal notation You must set the byte order Endian sign Sign and comparison range MSB or LSB The selectable ranges are as follows Unsigned Unsign 0 to 9E 18 T...

Page 63: ...bps to 1 Mbps in 0 1 kbps steps Sample Point Sample Point You can set the reference that will be used to determine the bus level recessive or dominant of the CAN FD bus signal s arbitration phase in the range of 18 8 to 90 6 in 0 1 steps The idea of sample point is the same as CAN bus signals Data Bit Rate Data Bit Rate Select the CAN FD bus signal s data phase data transfer rate from one of the s...

Page 64: ...s the same as that of the CAN bus trigger Level Level HF Rejection HF Rejection Set these items for the trigger source These items are the same as those of the edge trigger Hysteresis Hysteresis This item is the same as that of the CAN bus trigger 4 Triggering ...

Page 65: ...6 7 8 Arbitration Field DLC ESI BRS FDF r0 r1 ACK Slot ACK Delimiter CAN FD Data Frame 17 21 1 2 1 2 CRC Delimiter 8N 0 N 64 Control Field Data Field CRC Field SOF SRR IDE 3 1 Stuff Count Parity Stuff Bit Count CAN FD non ISO 1 11 1 1 1 1 1 7 1 4 1 1 18 ID 28 18 ACK ID 17 0 CRC Sequence EOF Data 1 2 3 4 5 6 7 8 Arbitration Field DLC ESI BRS FDF r0 r1 ACK Slot ACK Delimiter CAN FD Data Frame 17 21 ...

Page 66: ...Field Synch Field Protected Identifier Field Data 1 Data 2 Data N Checksum Inter byte Spaces Inter byte Space Response Response Space Trigger Mode Mode Select the LIN bus trigger mode from one of the settings below Break Synch Triggers on a break field or synch field Error Triggers on errors ID Data Triggers on the AND of the ID bit pattern and Data pattern ID OR Triggers on the OR of multiple ID ...

Page 67: ... ID and Data conditions If you specify X in the ID bit pattern or data pattern the condition is assumed to be met regardless of the corresponding bit status In a bit pattern or data pattern setting if a binary pattern contains any Xs the corresponding hexadecimal display will be Trigger Condition Condition Setup On the Condition Setup screen set the ID data and other trigger conditions Break Synch...

Page 68: ...Values a and b If the comparison condition is set to Data A Data a a Data Data b a Data b or Data a or b Data set the reference values in decimal notation You must set the byte order Endian sign Sign and comparison range MSB or LSB The selectable ranges are as follows Unsigned Unsign 0 to 9E 18 The selectable maximum value is limited by the data length and bit position which are determined by the ...

Page 69: ...r settings Source Source Set the trigger source to one of the settings below CH1 to CH4 Bit Rate Bit Rate Select the LIN bus signal s transfer rate from one of the settings below 1200 bps 2400 bps 4800 bps 9600 bps 19200 bps User Define If you select User Define set the transfer rate in the range of 1000 bps to 20000 bps in 10 bps steps Sample Point Sample Point You can set the reference that will...

Page 70: ...TYPE Field PID Field Data Bytes Field CRC Field Long Frame Frame Information IBS IBS IBS IBS IBS IBS Extension DLC 1 byte 1 byte 4 bits 2 bits 2 bits 1 byte 0 255 bytes 2 bytes IBS IBS PTYPE at the start of each frame is an option for the polling method When the option is not used the start of the frame is a PID Refer to this figure along with the figures in Trigger Point Trigger Mode Mode Select ...

Page 71: ...tion or data pattern the condition is assumed to be met regardless of the corresponding bit or item status In a bit pattern or data pattern setting if a binary pattern contains any Xs the corresponding hexadecimal display will be SOF The instrument triggers on the start of a CXPI bus signal frame when the trigger condition is set to SOF only SOF of ID Data is always selected as a trigger condition...

Page 72: ...e value is not equal to the reference value a Data1 When the value is greater than or equal to the reference value Data b1 When the value is less than or equal to the reference value a Data b2 When the value is within the reference range including the reference values Data a b Data2 When the value is outside the reference range excluding the reference values 1 Set one reference value 2 Set two ref...

Page 73: ...dless of the presence of PTYPE ID1 to ID4 You can set up to four IDs IDs whose check boxes are selected are used as trigger conditions The ID trigger condition is met when the input signal ID bit pattern matches any of the specified ID bit patterns The method for setting the bit pattern of each ID is the same as with the ID Data setting Wakeup Sleep The instrument triggers on any of the following ...

Page 74: ...ine the value as follows Logical value 1 when the low width of the current bit is less than or equal to the threshold Logical value 0 when the low width of the current bit is greater than the threshold Selectable range 0 010 Tbit to 0 300 Tbit Resolution 0 001 Tbit Tbit is the time width of a bit calculated from the bit rate Clock Tolerance Clock Tolerance Set the tolerance of the clock width calc...

Page 75: ...ition of the stop bit of a frame information field 10 Data when Size 0 End position of the stop bit of a specified data bytes field Error Trigger Points IBS Data 1 Data 2 Data N P P DLC NM CT Frame Type Frame ID PTYPE Field PID Field Data Bytes Field CRC Field Frame Information IBS IBS IBS IBS IBS IBS 1 byte 1 byte 4 bits 2 bits 2 bits 0 12 bytes 1 byte Normal Frame IBS 1 2 3 1 1 2 3 4 1 3 4 1 3 4...

Page 76: ...tension DLC field 10 Data when Size 0 End position of the stop bit of a specified data bytes field Error Trigger Points IBS Data 1 Data 2 Data N P P DLC NM CT Frame Type Frame ID PTYPE Field PID Field Data Bytes Field CRC Field Long Frame Frame Information IBS IBS IBS IBS IBS IBS Extension DLC 1 byte 1 byte 4 bits 2 bits 2 bits 1 byte 0 255 bytes 2 bytes IBS IBS 1 2 3 1 1 2 3 4 1 3 4 1 3 4 1 3 4 1...

Page 77: ...lock detection position after sleep where 1 clock is guaranteed Clock Error 3 SOF Within frame Sleep 2 1 1 Positions 1 to 3 above are trigger points for the following conditions 1 Clock Error Position where a clock less than clock error 1 Tbit 1 absolute value of clock tolerance 100 2 Clock Error Position at 1 Tbit absolute value of clock tolerance 100 from the falling edge detected during sleep 3...

Page 78: ...te nibble values Trigger Mode Mode Select the SENT trigger mode from one of the settings below Every Fast CH Triggers when a fast channel message is detected Fast CH S C Triggers on the status and communication bit pattern Fast CH Data Triggers on the AND of the fast channel data Every Slow CH Triggers when a slow channel message is detected Slow CH ID Data Triggers on the AND of the slow channel ...

Page 79: ...pattern False When the value does not match the data pattern Data Pattern Hex Bin Set the data pattern for the data nibble in hexadecimal Hex or binary Bin notation When the data type is User Comparison Condition Condition The data trigger condition is met when the result of comparing the user specified Data1 to Data4 values to the input signal s data value meets the specified comparison condition...

Page 80: ...the specified data pattern ID a2 Data a2 When the value is equal to the reference value ID a2 Data a2 When the value is not equal to the reference value a ID2 a Data2 When the value is greater than or equal to the reference value ID b2 Data b2 When the value is less than or equal to the reference value a ID b3 a Data b3 When the value is within the reference range including the reference values ID...

Page 81: ...rument triggers if any of the selected errors is detected Successive CAL Pulses The instrument triggers when successive SYNC CAL pulses differ by 1 64 clock ticks or more The comparison condition varies depending on the format setting explained later Nibble Number The instrument triggers when the number of nibbles in the message does not match the specified number of nibbles The specified number o...

Page 82: ...rsion APR2016 and JAN2010 This is fixed to off for version FEB2008 and older ON Pause pulses are included OFF Pause pulses are not included CRC Type Select the CRC type Select this for version APR2016 and JAN2010 This is fixed to Legacy for version FEB2008 and older Recommended CRC is added using the type recommended in version APR2016 or JAN2010 Legacy CRC is added using the type recommended in v...

Page 83: ... the trigger source is set to LOGIC and the 701989 logic probe is connected Hysteresis Hysteresis You can set this only when the trigger source is CH1 to CH4 This item is the same as that of the CAN bus trigger Trigger Point The following figures illustrate the trigger points For other trigger points see appendix 6 Message 1 Message 2 Message N ID Data CRC Slow CH S C 1 2 6 7 9 3 7 7 7 4 5 10 7 8 ...

Page 84: ...d data pattern Trigger Condition Condition Setup Data Length Size Set how many consecutive data bytes will be compared Selectable range 1 to 4 bytes Comparison Condition Condition The instrument triggers when the input signal data value matches the data pattern Input Format Input Format For the data whose length was specified by Data Size set the condition using a data pattern or ASCII character c...

Page 85: ...hich bit state will be recognized to be logic 1 0 1 Positive logic 0 1 Negative logic Sample Point Sample Point You can set the reference that will be used to determine the signal level in the range of 18 8 to 90 6 in 3 1 steps The instrument s UART signal trigger circuit samples the input UART signal using the internal clock and detects the point of level change Set the sample point as a percenta...

Page 86: ...urce from one of the settings below If you set the source to LOGIC set the source bit Bit0 to Bit7 and level CH1 to CH4 LOGIC Bit 0 to Bit 7 Level Level HF Rejection HF Rejection Noise Rejection Noise Rejection Set these items for the SCL and SDA sources These items are the same as those of the edge trigger You can set this only when the trigger source is set to LOGIC and the 701989 logic probe is...

Page 87: ...data pattern items whose check box is selected Start Start Condition If the only trigger condition is the start condition when a start condition is detected the instrument triggers on the SDA signal s falling edge Address Type Set the address type to 7bit Address 7bit Sub Address or 10bit Address Data Direction Bit Status Direction Set the data direction bit R W bit to don t care X write Write or ...

Page 88: ...Hex Bin Set the data pattern for the specified data size in hexadecimal Hex or binary Bin notation R W Bit Inclusion Include R W Select whether to include or omit the R W bit when you set the address pattern ON Include the R W bit address R W bit hexadecimal or binary OFF Omit the R W bit address hexadecimal or binary R W bit set with Direction You can set R W bit inclusion Include R W under the c...

Page 89: ...the second byte address Trigger Condition Condition Setup On the Condition Setup screen set the trigger conditions The instrument triggers based on the general call and second byte items whose check box is selected General Call The instrument triggers on the general call address 0000 0000 This is always set as a trigger condition Second Byte You can use the second byte address pattern the byte aft...

Page 90: ...it 1 Determines whether the first byte is a general call address 2 Determines whether the address pattern is 06 Trigger when the second byte address matches the specified pattern Mode General Call Second Byte Master Address Address pattern 1010 1011 0xAB Data Condition True Size 2 bytes Data pattern 2 When the position is not specified S 27 AB AE 57 27 AE 98 99 P 00 4 Triggers here Address R W bit...

Page 91: ...SPI Bus Trigger ENHANCED option The instrument triggers based on the conditions of SPI bus signal data patterns The following figure shows the SPI bus signal timing chart Clock 0 1 2 3 4 5 6 7 Position Data 1 or Data 2 CS Low Active Wiring System Mode Select from the following 3 wire The instrument triggers on the data pattern condition of one data line 4 wire The instrument triggers on the data p...

Page 92: ... When the data stream starts with the LSB Data Length Size Set how many consecutive data bytes will be compared Selectable range 1 to 4 bytes Comparison Start Position Position Set the comparison start position For example to start comparing from the first data byte after the chip select signal is activated specify zero If you do not set the comparison start point the data trigger condition is met...

Page 93: ...the clock polarity setting as follows Polarity Trigger point when the polarity is set to Clock Data 1 or Data 2 Polarity Trigger point when the polarity is set to Example This example displays the data sequence in hexadecimal Hex notation and indicates the trigger position The Data1 and Data2 pattern references are set to A1 and A2 respectively Shading Pattern to compare CS Active L Data 1 Conditi...

Page 94: ...at will be used to sample the data source Clock Source Source Set the clock source to one of the settings below The available settings vary depending on the model CH1 to CH4 Polarity Polarity You can select which clock source edge causes the data source to be sampled On the rising edge On the falling edge Enable Enable When the data source is sampled in sync with the clock source whether sampling ...

Page 95: ...ition is met when the sampled data source pattern matches the specified pattern Data Length Data Size Set the data pattern bit length Selectable range 1 to 128 bits Data Pattern Hex Bin Set the data pattern for the specified data size in hexadecimal Hex or binary Bin notation If you specify X in the pattern the condition is assumed to be met regardless of the corresponding bit status If a binary p...

Page 96: ...ource Set the trigger source to a channel from CH1 to CH4 The available settings vary depending on the model Polarity Polarity Select which polarity the TV signal must be with respect to the trigger level for the instrument to trigger Pos Positive Neg Negative Trigger Level Level Set the trigger level in units of divisions with the peak value equal to 0 divisions Selectable range 0 1 to 2 0 div Re...

Page 97: ...ed every 4 frames 8 The instrument skips 7 frame and triggers on the specified field on the subsequent frame This operation is repeated every 8 frames HF rejection settings are ignored NTSC Example The following line numbers are those when the field number is set to 1 if the field number is set to 2 the numbers are assigned sequentially by setting 268 to 5 524 525 1 2 3 4 5 6 7 8 9 10 11 12 13 14 ...

Page 98: ... 1166 2251 1682 1687 1688 1169 1170 1173 1174 1728 The line numbers inside parentheses cannot be specified 720 60p Example 750 1 2 3 4 5 6 7 5H 5H 20H 30H Line number 2250 751 752 753 754 755 756 757 2251 The line numbers inside parentheses cannot be specified Example for 1080 25p 1080 24p or 1080 60p 1125 1 2 3 4 5 6 7 5H 5H 35H 45H Line number 2250 1126 1127 1128 1129 1130 1131 1132 2251 The lin...

Page 99: ... B is the trigger you set using the B TRIG key The instrument can trigger on the combination of trigger A condition A and trigger B condition B The trigger conditions you set using the EDGE or ENHANCED key are the trigger A conditions The trigger conditions you set using the B TRIG key menu are the trigger B conditions Trigger Combination Combination Set how to combine trigger A and B conditions O...

Page 100: ...gger type of one of the triggers has two levels upper level and lower level and that of the other has one level the center value of the two levels and the single level are shared Configuring the Trigger B Conditions The items that you can set vary depending on the A and B trigger types that you selected A Delay B Trigger Configure these items for trigger B trigger type trigger source trigger level...

Page 101: ...ecutes the specified action each time the conditions are met You can specify any of the four actions below Buzzer Buzzer Sounds an alarm Print or Save the Screen Image Print Prints the screen image to the printer Printer built in printer USB USB printer specified by Print to in the PRINT menu or stores the screen image data to the specified storage device Save the Waveform Data SaveWaveform Stores...

Page 102: ...In Select3 Polygon C1 Main Condition In Select4 Measure Max C1 Upper 0 0000E 00 Lower 0 0000E 00 Condition In Logic OR Stop Nogo Action Count 1 Inf Trigger Date and Time 2018 06 01 21 18 51 Nogo Exec Count 1 1 Nogo Factor Select1 Rect C1 Main Select2 Wave C1 Main Number of Actions Action Count Nogo Count When the number of waveform acquisitions reaches the specified action count or when the number...

Page 103: ...re no go Reference Conditions 1 to 4 For reference conditions 1 to 4 set the source waveform reference range the zone or the waveform parameter upper and lower limits and the reference criterion 1 and 2 on the 2 channel model Reference Criterion Condition Set whether the source waveform must be in or out of the reference range to produce a no go result IN No go when the source waveform is within t...

Page 104: ...ear when the determination source waveform display is set to off Creating a Waveform Zone WaveZone Create a zone based on the source waveform You can also use other waveforms to create the zone 1 You can create up to four waveform zones One of them is used for GO NO GO determination T Range2 T Range1 When the NO GO determination condition is set to OUT a no go judgment is made here Determination S...

Page 105: ...tarting Over the Editing Exec To start over the editing of the waveform zones press this soft key If you press this key all the zones that you have edited up to that point will be lost If you want to continue editing existing zones do not press this soft key Even if you press the Exec soft key and clear the zones the original zones are stored if you have stored them in the past according to the pr...

Page 106: ... want to use for determination Moving the Polygonal Zone V Position H Position You can move the loaded polygon image vertically or horizontally Selectable V Position range 4 divisions Selectable H Position range 5 divisions Setting the Reference Range Using a Waveform Parameter Parameter Set upper and lower limits on a measured item obtained through the automated measurement of waveform parameters...

Page 107: ...naming method using the FILE menu as the number of saved files increases the amount of time required to save a file will also increase Also the maximum number of files that can be saved using sequential numbering is 1000 To save more than 1000 files set the automatic naming function so that files are named by date If you use the automatic naming function to save data to files GO NO GO determinatio...

Page 108: ...ption If you want to observe a long term phenomenon at a high time resolution at a high sample rate set the record length to a high value When the record length is long computation and measurement processing take longer than when the record length is short The following limitations on waveform acquisition conditions and the number of waveforms that can be stored in the acquisition memory the numbe...

Page 109: ...or less Envelope mode Normal mode If you set the acquisition mode to Envelope when the sample rate is set to 1 25 GS s or higher the instrument actually operates in Normal mode In envelope mode Envelope appears in the upper right of the screen If envelope is in use in high resolution mode Env Hi Res appears Averaging Mode Average In Averaging mode the instrument acquires waveforms numerous times a...

Page 110: ...ent continues waveform acquisition until you stop it using the RUN STOP key The default setting is Infinite You cannot change the number of acquisitions during waveform acquisition If you want to change it stop acquisition first Selectable range 1 to 65536 or Infinite The number of waveforms that have been stored to the acquisition memory appears at the upper left of the screen High Resolution Mod...

Page 111: ...nstrument can only display waveforms up to the frequency that corresponds to one half the sample rate in accordance with the sampling theorem Therefore this mode is suitable for observing waveforms whose frequency is lower than one half the sample rate If the sample rate is comparatively low with respect to the input signal frequency the harmonics contained in the signal are lost When this happens...

Page 112: ...s When the Acquisition Mode Is Set to Averaging Averaging stops when you stop acquisition If you execute acquisition again averaging starts from the beginning RUN and STOP Operations during Accumulation Accumulation stops when you stop waveform acquisition When you execute acquisition again the displayed waveforms up to that point are cleared and accumulation restarts from the beginning The RUN ST...

Page 113: ...ilable on 4 channel models 2 The FFT window and the Trend Histogram window are the same 3 Only Trend1 or Hist1 can be displayed on 2 channel models Up to two items can be displayed on 4 channel models Display Example FFT Trend Histogram XY2 XY1 Zoom1 Main Zoom2 Display Format Format You can evenly divide the VT waveform display window so that you can easily view input waveforms and computed wavefo...

Page 114: ...chapter 15 Analyzing and Searching Serial Bus Signals Initialization Intensity and color can be reset to default values To reset the intensity of the grid zoom box cursor or marker to its default value select the item that you want to reset and then press RESET To reset the colors of the waveform and serial bus trend press DEFAULT SETUP However be careful as pressing DEFAULT SETUP will also reset ...

Page 115: ...raticule Graticule Set the window grid to one of the settings below Dot Grid Displays the grid using broken lines Line Grid Displays the grid using solid lines Frame Displays a frame Cross Hair Displays the grid using crosshairs Fine Grid Display Fine Grid You can set whether or not to display the fine grid ON Displays the fine grid OFF Does not display the fine grid Scale Value Display Scale Valu...

Page 116: ...uency using different colors Indicates 15 frequency levels using different colors that range from blue to green to yellow to red to white starting with the lowest frequency OFF Does not accumulate waveforms Accumulation Time Accum Time Sets the amount of time to retain waveforms on the screen Selectable range 100 ms to 100 s or Infinite Infinite If you press CLR the accumulated waveforms are clear...

Page 117: ...rm Display On and Off Display Sets whether or not to measure and display XY waveforms If you set this to ON the XY window appears ON Displays and measures XY waveforms OFF Does not display or measure XY waveforms X Axis and Y Axis Source Waveforms X Trace Y Trace Select the waveforms to assign to the X axes and Y axes of the XY1 and XY2 waveforms The available settings vary depending on the model ...

Page 118: ...alues for Cursor1 and Cursor2 You can set the cursors in the range of 4 divisions in 0 01 division steps Horizontal cursor You can measure the Y axis values for Cursor1 and Cursor2 You can set the cursors in the range of 4 divisions in 0 01 division steps Measurement Item Item The instrument measures the values of the items listed below that you select X1 X axis value at Cursor1 Y1 Y axis value at...

Page 119: ...cannot be used Even if Ref is selected it appears as Math1 to Math4 in the various source selection menus Computation Source Waveforms Source1 Source2 If you set the computation mode to Math you can select the computation source waveforms for Math Ref1 to Math Ref4 from one of the settings below Depending on the operator you may need to select only Source1 or Source1 and Source2 The available sett...

Page 120: ... reference waveform If reference waveform Ref1 is displayed and you set the computation source waveform of Math2 to Math1 you can perform computation using reference waveform Ref1 The same holds true for Math1 and Math2 for Math3 and Math1 to Math3 for Math4 Vertical Position Position You can move the reference waveform vertical position within 4 divisions In computation where the time axis is dif...

Page 121: ... two waveforms assigned to Source1 and Source2 IIR Filter Smoothing Filter S1 Performs phase shifting or moving average on the waveform assigned to Source1 or applies an IIR filter to the waveform Selecting the Filter Type Filter Setup Set the filter type to one of the settings below Delay Displays a phase shifted waveform Moving Avg Displays a waveform whose noise has been eliminated through movi...

Page 122: ...ss Low Pass 2 No phase change Cutoff frequency Cutoff1 You can set the cutoff frequency to a value up to 500 MHz In the filter calculation IIR filter because the initial value is indeterminate correct calculation is not possible immediately after the start of calculation With a first order filter the left end of the waveform is not shown and with a second order filter both ends of the waveform are...

Page 123: ...phase B The state when the waveform is above the specified threshold level is considered to be 1 The state when the waveform is below the threshold level is considered to be 0 Depending on how phase A and phase B change the counter is incremented or decremented The instrument counts the number of phase changes with the initial point Initial Point set to zero In addition the counter can be reset us...

Page 124: ...tial Point Set the initial point when integrating counting edges or counting rotations The instrument integrates and counts by assuming the initial point to be zero You can set the initial point numerically or set it to a specific point such as the trigger position or 0 divisions Selectable range 5 00 div to 5 00 div Resolution 0 01 div Setting a Specific Point Set to You can set the initial point...

Page 125: ...aling Set the sensitivity Sensitivity 2 and the level1 at the vertical center Center of the screen area 1 Voltage for a voltage waveform 2 Voltage per division for a voltage waveform If you change the operator during manual scaling the instrument changes the display range to the auto display range that corresponds to the new operator Ranging remains set to Manual User Defined Computation User Defi...

Page 126: ...aveform FILT2 FILT2 C1 Application of a digital filter to the input waveform HLBT HLBT C1 Hilbert function of the input waveform MEAN MEAN C1 10 Moving average of the input waveform DELAY DELAY C1 0 001 Phase shifting of the input waveform BIN BIN CH1 1 1 Conversion of the input waveform into binary values Pulse width functions PWHH PWHH C1 1 1 Pulse width computation of the input waveform from a ...

Page 127: ...asurement values of waveform parameters in expressions P precedes waveform parameters when waveform parameters are displayed in expressions The instrument cannot retrieve waveform parameter values when the measurement source waveform display is off D A conversion can be specified only when the computation source waveform is Bus The computation result will be the same as the bus display Hex value C...

Page 128: ...u can also set the display range by specifying the vertical center Center of the display area and the value per division Sensitivity Computation on History Waveforms Math on History This feature performs computation on all history waveforms If waveform acquisition is stopped and you press the Math on History soft key the instrument performs user defined computation on all of the source channel s h...

Page 129: ... filters must be defined MEAN Moving Average Examples Syntax MEAN parameter 1 parameter 2 Parameter 1 Set the source waveform of the moving average Enter a waveform or an expression that contains waveforms Parameter 2 Set the moving average coefficient Enter a constant or a constant expression MEAN C1 10 Moving average of waveform C1 with the coefficient set to 10 MEAN C2 C3 K1 Moving average of t...

Page 130: ...t the lower threshold level Enter a constant or a constant expression PWHH C1 K1 K2 Compute the pulse width of waveform C1 with Upper set to K1 and Lower set to K2 DUTYH C2 P High C2 P Low C2 Compute the pulse width of waveform C2 with Upper set to waveform C2 s high value and Lower set to waveform C2 s low value PWHH 5 10 2 Not allowed because parameter 1 is not a waveform PWHL C1 C2 1 Not allowe...

Page 131: ...d pulse width Example PWHH C1 1 0 C2 When converting to binary values or when computing pulse width the source waveform can only be a single waveform Example BIN C1 C2 1 1 PWHH C1 C2 0 0 Averaging cannot be performed on pulse width computation If you want to covert the result of a computation such as C1 C2 to binary values or perform pulse width computation on it define the Math1 and Math2 express...

Page 132: ...el model T T T T t Sine wave Time windows Integral Power Spectrum Rectangular Hanning Rectangular Hanning Flat top W t u t u t T u t Step function W t 0 5 0 5cos 2 W t 0 54 0 46 cos 2 T T Flat top t T t T sin 2 1 2t T 2 1 2t T Turning the FFT On or Off Display Set whether or not to perform FFT analysis If you set this to ON the FFT window appears ON Performs FFT analysis OFF Does not perform FFT a...

Page 133: ...tion of source units PSD LOGMAG Logarithmic amplitude of the power spectrum density of the specified waveform dB and source unit CS MAG Magnitude of the cross spectrum of the specified two waveforms Enumeration of source units CS LOGMAG Logarithmic amplitude of the cross spectrum of the two specified waveforms If the source units are the same dB and source unit If the source units are different dB...

Page 134: ...g on the type spectrum User Define You can assign a unit User Unit using up to four characters Number of FFT Points FFT Point You can select from one of the settings below 1 25 k 2 5 k 12 5 k 25 k 125 k 250 k 1 25 M Relationship between the Number of FFT Points and Number of Displayed Points Display Record Length Depending on the number of displayed points in the window that you select using the a...

Page 135: ...g marker cursors and peak cursors Cursor Type Mode Set the cursor that you want to use for analyzing to one of the settings below OFF Disables cursor measurement Marker Using two marker cursors you can display frequencies levels and the difference between the markers Peak Using the detection level and excursion you can display frequencies and levels Marker Cursor Marker The instrument displays the...

Page 136: ...k is detected This is greater than the threshold This peak is not detected This is less than the threshold Threshold value Difference between peak and valley excursion Peaks whose amount of change from the peak value the difference between the peak and valley is greater than the specified value are measured 20 dBV 10 dBV 5 dBV Example Excursion 20 dBV This peak is detected The peak bottom differen...

Page 137: ...angles Measurement Source Waveform Trace Set the measurement source waveform to one of the waveforms below The available settings vary depending on the model CH1 to CH4 LOGIC 1 2 Math1 to Math4 All3 1 Select the CH4 or LOGIC key to choose the waveform you want to perform cursor measurement on The selected waveform s key illuminates 2 If the source waveform is a logic signal LOGIC you can only use ...

Page 138: ...erence in the vertical values at the points where Cursor1 and Cursor2 intersect the waveforms If you set the measurement source waveform to All values of all the measurement items are measured for CH1 through CH4 LOGIC and Math1 to Math4 Example of Logic Signal Measurement The instrument displays measured values according to the format Format and bit order Bit Order settings in the LOGIC menu Bit0...

Page 139: ...lay format to one of the settings below Mark A dot Line A crosshair Line Mark Marker1 Marker2 Marker3 Marker4 Marker1 Marker2 Marker3 Marker4 Markers Marker1 through 4 Enables or disables each of the markers If you enable a marker set the measurement source waveform and the measurement items You can assign each marker to separate waveforms OFF Disables the marker CH1 to CH4 Math1 to Math4 Sets the...

Page 140: ...e zero point Ref Cursor1 position which will be the measurement reference the end point Ref Cursor2 position and the reference angle Reference Angle Ref Value Set the reference angle you want to assign to the range defined by Ref Cursor1 and Ref Cursor2 Selectable range 1 to 720 Angle Unit Unit You can set the angle unit using any characters you like Reference Cursors Ref Cursor Set the zero point...

Page 141: ...se marker cursors move on the sampled data you can always read sampled data Cursor Jumping Cursor Jump T Cursor Jump You can make Cursor1 Cursor2 or Marker1 to Marker4 jump to the center of the specified zoom window The jump options are listed below When the cursor is ΔT the ΔT ΔV ΔT cursor or Degree Cursor1 to Zoom1 Cursor1 jumps to the Zoom1 window Cursor1 to Cursor1 to Zoom2 Cursor1 jumps to th...

Page 142: ...bles automated measurement OFF Disables automated measurement Source Waveform Source Selects the automated measurement source waveform The available settings vary depending on the model CH1 to CH4 LOGIC Bit0 to Bit7 Math1 to Math4 CH4 or LOGIC whichever the corresponding key is illuminated can be selected Measurements cannot be made on a snapshot waveform or an accumulated waveform that is not the...

Page 143: ...can read out the values of measurement items that are not displayed on the screen by using communication features If you execute GO NO GO determination based on a waveform parameter automated measurement turns on If the power measurement mode of the power supply analysis feature G03 option is turned on you will not be able to set the following measurement items Max Min P P Rms Mean Sdev Avg Freq V...

Page 144: ...veform is above the mesial reference line s Width Time span when the waveform is below the mesial reference line s Duty Duty cycle Width Period 100 Width Width Period Distal Mesial Proximal Rise Rise time s Fall Fall time s Rise Fall Distal 90 Proximal 10 High 100 Low 0 Delay Delay between waveforms s Freq Period Width Width Rise Fall and Duty parameters are measured on the first period of the wav...

Page 145: ...he start point T Range1 of the time range to use as a detected point reference point or measured point The selectable range is 1 to 10 Unit Sets the unit for displaying the delay between waveforms to Time or Degree when Reference is not set to Trigger Position Time Displays the delay between waveforms in time Degree Displays the delay between waveforms as an angle Conversion formula angle delay s ...

Page 146: ...Maximum voltage V Min Minimum voltage V P P P P value Max Min V High High voltage V Low Low voltage V Amplitude Amplitude High Low V Rms Rms voltage V 1 n Σ xN2 1 2 Mean Mean voltage V 1 n ΣxN Sdev Standard deviation V ΣxN2 ΣxN 2 n n 1 2 IntegTY Area under the positive parts Vs IntegTY Area under the positive parts area under the negative parts Vs Over Overshoot Max High High Low 100 Over Undersho...

Page 147: ...e of the voltage source waveform How to Determine the High and Low Values Selects how the instrument determines the 100 High and 0 Low levels of the measurement source Auto Sets the high value to the high amplitude level and the low value to the low amplitude level based on the voltage level frequency of the source waveform in the time range taking into account the effects from ringing spikes etc ...

Page 148: ... feature Save the statistical items as automated measurement values of waveform parameters and load the data into a PC Statistical Processing Mode Mode Set the statistical processing mode to one of the settings below OFF Disables statistical processing Continuous Normal statistical processing Cycle Statistical processing of measured values for each period cyclic statistical processing History Stat...

Page 149: ...on all source waveforms If you select LOGIC select the source bit CH4 or LOGIC whichever the corresponding key is illuminated can be selected Measures the items in ranges a b and c and calculates statistics on the items in the order a b and c The items of other channels are also measured in ranges a b and c If you select Own the items are measured automatically over each waveform s period Example ...

Page 150: ...Data b a value less than or equal to the specified value a Data b a value between two specified values Jump When Search Mode is set to OFF Jumps to and highlights the specified destination Statistics Max maximum value Statistics Min minimum value Oldest or Latest Jump to Search Point When Search Mode is not set to OFF Jumps to and highlights the specified destination You can specify any of the sea...

Page 151: ...n the trend or histogram display The measurement items that are turned on in the Item Setup screen for the automated measurement of waveform parameters appear in the list Configuring the Display Display Setup You can turn on and off the VT waveform display shared with the trend and histogram display and specify how to set the display scale trend display only Auto Scale Exec Executes auto scaling o...

Page 152: ...measure the Cursor1 value the Cursor2 value and the difference between the two cursor values Measurement Item Item The instrument measures the values of the items listed below that you select Peak Peak value Max Maximum value Min Minimum value Mean Mean value σ Standard deviation of the histogram Median Median Integ σ Percentage of values that fall within σ Integ 2σ Percentage of values that fall ...

Page 153: ...eform parameters Name Name You can specify a name of up to eight characters in length for the computation that you have defined The specified name is displayed on the screen Expression Expression Be sure to include a waveform parameter in the expressions The available operators and how to use them are described below Menu Item Example Description Max C1 Min C1 Basic arithmetic of the input value A...

Page 154: ...ing up to four characters Notes about Automated Measurement of Waveform Parameters When an item is impossible to measure its measured value is displayed as The instrument may not measure correctly if the waveform amplitude is small To stop automated measurement select OFF by pressing MEASURE Mode soft key Measurement stops immediately Notes about Statistical Processing If the statistical processin...

Page 155: ...ow are displayed at the same time a zoom box appears in the Main window so that you can check the zoom position Turning the Zoom Windows On or Off Display Sets whether or not to display zoom windows OFF Does not display the zoom windows ON Displays the zoom windows The ZOOM1 and ZOOM2 keys illuminate when the zoom feature is on The ZOOM knob controls the waveforms in the window whose corresponding...

Page 156: ...level Zoom Source Waveforms Trace You can select the zoom source waveforms from the waveforms below The available settings vary depending on the model CH1 to CH4 LOGIC Math1 to Math4 CH4 or LOGIC whichever the corresponding key is illuminated can be selected If you select a waveform whose display is turned off in the main window the zoom waveform does not appear Zoom Factor ZOOM knob You can set s...

Page 157: ...and 2 positions while maintaining the same distance between the two zoom boxes Vertical Zoom Vertical Zoom Zoom Source Waveform Set the zoom source waveform to one of the waveforms below The available settings vary depending on the model CH1 to CH4 Math1 to Math4 Zoom Position V Position Taking the vertical center of the main window to be 0 divisions set the vertical center position of the zoom bo...

Page 158: ...ctable channels vary depending on the model CH4 or LOGIC whichever the corresponding key is illuminated can be selected If you select LOGIC select the source bit bit 0 to bit 7 If you select a channel that a reference waveform has been loaded into you can search the reference waveform If you set the source to a channel CH1 to CH4 that a waveform has been loaded into you can search the loaded wavef...

Page 159: ...n CH1 H CH2 L other channels X Logic AND Condition Enter Not met Not met Not met Not met Met Met CH1 CH2 CH3 L H H CH1 CH2 H H L L L Results of comparisons that have been sampled using the clock Comparison with the specified pattern Detected point Search Example 2 When the result of comparing the combination Logic of the trigger source signal pattern Pattern and the specified pattern is true or fa...

Page 160: ...he instrument searches for the end point of the achievement time t when the relationship between the duration the result Enter or Exit of the achievement condition Condition of comparing the combination Logic of the trigger source signal pattern Pattern and the reference time meets the specified time condition Time Qualification When the time condition is set to timeout the instrument searches for...

Page 161: ...l and other search conditions The items that you need to set vary depending on the search type that you select Edge Search Search Source Waveform Source You can select from one of the settings below The available settings vary depending on the model CH1 to CH4 LOGIC Math1 to Math4 CH4 or LOGIC whichever the corresponding key is illuminated can be selected If you select LOGIC select the source bit ...

Page 162: ...below the specified level to a level above the specified level rising When the source changes from a level above the specified level to a level below the specified level falling When a rising or falling edge is detected You cannot set a pattern to a signal that is set as the clock source Search Conditions Condition Search Source Pattern Pattern Set the search source CH1 to CH4 Bit0 to Bit7 Math1 t...

Page 163: ...tate These items are the same as those of the edge search Timeout Search Search Source Waveform Source You can select from one of the settings below The available settings vary depending on the model CH1 to CH4 LOGIC Math1 to Math4 CH4 or LOGIC whichever the corresponding key is illuminated can be selected If you select LOGIC select the source bit bit 0 to bit 7 Timeout Period Time Selectable rang...

Page 164: ... when both the Zoom1 and Zoom2 displays are turned on If Zoom1 and Zoom2 displays are both off and you press SEARCH the Zoom1 display turns on Zoom Position Z1 Position Z2 Position You can change the zoom position in the zoom window that is specified using Result Window in the menu accessible with the Display Setup soft key Search Skip Skip Mode After a search condition is met you can skip the det...

Page 165: ...tected point is zero The maximum detected point number is 50000 Executing a Search Search The instrument searches for positions where the specified search conditions are met Then the instrument displays the waveform expanded in the zoom window with the detected point that corresponds to the number you specify at the center Detected Points The detected points are the same as the trigger points You ...

Page 166: ... selected serial bus signal SERIAL BUS1 S1 only for 2 channel models ID 00A Engine ID Engine DLC 1 Zoom window Main window Zoom box Source Decoded display Source analysis source waveform Decoded display Detected point Turning the Analysis and Search Feature On or Off Display Set whether or not to perform serial bus signal analysis and searching If you turn this feature on the instrument displays t...

Page 167: ...exRay CAN CAN FD LIN CXPI SENT UART I2 C and SPI are options for 4 channel models FlexRay FlexRay bus signal CAN CAN bus signal CAN FD CAN FD bus signal LIN LIN bus signal CXPI CXPI bus signal SENT SENT signal UART UART signal I2C I2 C bus signal SPI SPI bus signal User Define User defined serial bus signal Bus Setup Setup Configure the settings necessary for serial bus signal analysis The setting...

Page 168: ...Bin ASCII Symbol Serial bus FlexRay Yes No Yes No No CAN Yes No Yes No Yes CAN FD Yes No Yes No Yes LIN Yes No Yes No No CXPI Yes No Yes No No SENT Yes Yes No No No UART Yes No Yes Yes No I2 C Yes No Yes Yes No SPI Yes No Yes Yes No User Define Yes No Yes Yes No You can display the decoded results using symbols by converting a CANdb file dbc to a physical value symbol definition file sbl using the...

Page 169: ...n Displays the list in full screen mode Half Upper Displays the list in the top half of the screen Half Lower Displays the list in the bottom half of the screen Detailed Display Detail If the bus type is UART When Grouping is on I2 C or SPI the instrument displays all of the data for the specified analysis number in hexadecimal notation and ASCII codes If you show the detailed display you can view...

Page 170: ... on the specified sources The auto setup feature automatically configures the bit rate bus channel level and hysteresis and triggers on the start of frame Frame Start of the FlexRay bus signal You cannot execute auto setup if the source is set to Math1 to Math4 Decoded Display Decode The colors that are used for the fields in the decoded display are as follows Indicator Yellow Yellow Frame ID Ligh...

Page 171: ...edence The errors are listed below in order of precedence with the highest precedence error first BSS Error BSS not detected FES Error FES not detected Header CRCError Incorrect header CRC CRC Error incorrect CRC If delay cancel Delay Cancel is set to OFF they are based on the trigger point Search Setup Search Search Type Mode Select the FlexRay bus signal search type from one of the settings belo...

Page 172: ... The recessive level is greater than the dominant level L The recessive level is less than the dominant level Sample Point Sample Point Set the reference that will be used to determine the bus level recessive or dominant in the range of 18 8 to 90 6 in 3 1 steps Level Level and Hysteresis Hys These items are the same as those of the edge search Auto Setup Auto Setup Executes auto setup based on th...

Page 173: ...Ack Displays Y when an ACK bit is detected and N otherwise Information Displays the following error information If multiple errors are detected in one piece of data the instrument displays a single error in the following order of precedence Stuff Error CRC Error If delay cancel Delay Cancel is set to OFF they are based on the trigger point Search Setup Search Search Type Mode Select the CAN bus si...

Page 174: ... below 500 kbps 1 Mbps 2 Mbps 4 Mbps 5 Mbps 8 Mbps User Define If you select User Define set the transfer rate in the range of 250 kbps to 10 Mbps in 0 1 kbps steps The data bit rate can be set as high as 16 times the arbitration phase bit rate Sample Point of the Data Phase Sample Point Set the reference that will be used to determine the bus level recessive or dominant of the CAN FD bus signal s...

Page 175: ...ame number zero Time ms Displays the time from the trigger position to the start of the frame in milliseconds Frame Displays the frame type The instrument can analyze the following four frame types data frame Data remote frame Remote error frame Error and overload frame Over load If the FDF bit is recessive FD is displayed in front of Data ID Displays the 11 bit standard format ID value or the 29 ...

Page 176: ...entioned CAN FD standard is set to ISO select the CRC error factor from one of the settings below You can also select both Stuff Count CRC Sequence ID Data The instrument searches for data frames and remote frames in the standard format Standard and the extended format Extend The instrument searches on the AND of the SOF ID frame type Remote Frame or Data Frame Data and ACK conditions If you speci...

Page 177: ...nge 0 to 8 bytes Comparison Start Position Position Set the position to start comparing the data pattern The left end of the data field is position 0 Selectable range 0 to 63 bytes If the comparison size Size is set to 0 comparison start position Position cannot be set The selectable range for position is limited so that Size Position is less than or equal to 64 Comparison Condition Condition The ...

Page 178: ...ode These items are the same as those of the CAN bus trigger Set the ACK slot state as a search condition Message Signal These items are the same as those of the CAN bus trigger Set the search conditions using Message and Signal Messages can be used when the ID input format is set to Message FDF Set the FDF bit state as a search condition 0 CAN When the FDF bit is dominant the instrument assumes t...

Page 179: ...determine the bus level in the range of 18 8 to 90 6 in 3 1 steps Level Level and Hysteresis Hys These items are the same as those of the edge search Auto Setup Auto Setup Executes auto setup based on the specified sources The auto setup feature automatically configures the bit rate revision sample point level and hysteresis and triggers on the LIN bus signal s Break Synch You cannot execute auto ...

Page 180: ... and displays the following signals and errors If a WakeUp signal is detected the instrument displays WakeUp If multiple errors are detected in one frame the instrument displays the error with the highest precedence The errors are listed below in order of precedence with the highest precedence error first Timeout Error Framing Error Checksum Error Synch Field Error ID Parity Error If delay cancel ...

Page 181: ...before the time determined by the following equation elapses the instrument triggers 1 4 THeader 2 TResponse 3 Header Timeout Error After a break detection if the header is not finished before the time determined by the following equation elapses the instrument triggers 1 4 THeader 2 Response Timeout Error After a break detection if the response is not finished before the time determined by the fo...

Page 182: ...n which T Sample is added to the low width of logical value 1 detected with the last bit is used as the threshold to determine the value as follows Logical value 1 when the low width of the current bit is less than or equal to the threshold Logical value 0 when the low width of the current bit is greater than the threshold Selectable range 0 010 Tbit to 0 300 Tbit Resolution 0 001 Tbit Tbit is the...

Page 183: ... Gray Gray fill IBS Gray Gray fill Wakeup pulse Green Green Error Red Red Parity Error CRC Error Counter CT Error Characters in the parity CRC or CT field in which an error occurred are displayed in black on a red background Data Length Error When the data length is less than DLC characters in the DLC field is displayed in black on a red background When the data length is greater than DLC characte...

Page 184: ...to two errors are displayed in the following order PTYPE Parity Error ID Parity Error CRC Error Data Length Error Framing Error IBS Error Clock Error Counter Error If delay cancel Delay Cancel is set to OFF they are based on the trigger point Search Setup Search Search Type Mode Select the CXPI bus signal search type from one of the settings below SOF Searches for the start of frame position Error...

Page 185: ... the start of a CXPI bus signal frame is detected when the search condition is set to SOF only the instrument detects it as a detected point SOF of ID Data is always selected as a search condition ID with PTYPE Whether the frame contains PTYPE is used as a search condition Yes Detects the ID of frames containing PTYPE No Detects the ID of frames not containing PTYPE X Detects the ID regardless of ...

Page 186: ...alue is not equal to the reference value a Data1 When the value is greater than or equal to the reference value Data b1 When the value is less than or equal to the reference value a Data b2 When the value is within the reference range including the reference values Data a b Data2 When the value is outside the reference range excluding the reference values 1 Set one reference value 2 Set two refere...

Page 187: ...n 250 μs and 2500 μs is detected Wakeup When a transition from a state in which there is no clock after a sleep detection to a state in which there is a clock is detected Sleep Frame When the sleep frame ID value is 1F hexadecimal Sleep When 5 ms elapses after a transition is made from a state in which there is a clock to a state in which there is no clock Executing a Search Search The instrument ...

Page 188: ... Set the data sizes of Data1 to Data4 in the range of 0 to 24 bits Select whether or not to display Data1 to Data4 The total number of bits for Data1 to Data4 is up to 24 If you try to exceed the total number of bits the data size of other pieces of Data is reduced If as a result of executing auto setup explained later the number of data nibbles in the input SENT signal is less than six the total ...

Page 189: ...er position The instrument can display the analysis results for up to 100000 frames in the range of 99999 to 99999 Pressing the RESET key highlights frame number zero Time ms Displays the time from the trigger position to the start of the frame in milliseconds Sync μs Displays the time period of the SYNC CAL field Tick μs Displays the time period of a clock tick S C Displays the time period of the...

Page 190: ...y the data values using the cursor measurement function Trend Display Display Set whether or not to display the trend The trend is displayed in the Trend window The trend is not displayed for data of messages that contain errors Such areas become blank ON The trend is displayed OFF The trend is not displayed Display Source Source Select the channel to display the trend of from one of the settings ...

Page 191: ...ot display the VT waveform display window Upper Lower Set the vertical scale values of the trend display Cursor Measurement Cursor You can perform cursor measurement on the trend ON Cursor1 and Cursor2 values are measured OFF Cursor measurement is not performed T1 Time value of Cursor1 time from the trigger position T2 Time value of Cursor2 time from the trigger position ΔT Difference between the ...

Page 192: ...ches for the position where the AND condition of the slow channel ID and data is met Error Searches for errors The method to set search conditions is the same as that for the trigger conditions of the SENT trigger Set the ID and data using the format selected in the decode menu Executing a Search Search The instrument searches for locations where the specified search conditions are met Then the in...

Page 193: ...range of 1000 bps to 10000000 bps in 100 bps steps Bit Order Bit Order and Polarity Polarity These items are the same as those of the UART signal Sample Point Sample Point You can set the reference that will be used to determine the signal level in the range of 18 8 to 90 6 in 3 1 steps Data Format Format Select from the following 8 bit No Parity 8 bit data no parity bit 7 bit Parity 7 bit data pa...

Page 194: ...sis Hys These items are the same as those of the edge search Auto Setup Auto Setup Executes auto setup based on the specified sources The auto setup feature automatically configures the bit rate sample point level and hysteresis and then triggers on the UART signal s Stop Bit You cannot execute auto setup when The sources is set to Math1 to Math4 State display is applied to a LOGIC bit that is set...

Page 195: ...rror indication Framing Error Parity Error If delay cancel Delay Cancel is set to OFF they are based on the trigger point When Grouping Is Set to OFF Addr Displays the address relative to the first data address Hex Displays the data in hexadecimal notation An asterisk or an X is attached to the data if a framing error or a parity error is detected respectively Ascii Displays the data using ASCII c...

Page 196: ...l You cannot execute auto setup when SCL or SDA source is set to Math1 to Math4 State display is applied to a LOGIC bit set as the SCL or SDA source R W Bit Inclusion Include R W When you set the address pattern input format to hexadecimal you can choose to include or omit the R W bit when you set the address pattern ON Include the R W bit address R W bit hexadecimal OFF Omit the R W bit address h...

Page 197: ...call Start byte Hs mode 10 bit 7 bit CBus 1 If delay cancel Delay Cancel is set to OFF they are based on the trigger point 2 You can use the R W bit inclusion setting Include R W to choose whether or not to include the R W bit in the displayed address Search Setup Search Search Type Mode I2 C bus signal search type from one of the settings below and set the search conditions Every Start Searches f...

Page 198: ...played starting from the first rising or falling clock edge after the specified idle time When Grouping is set to OFF the data is decoded from the left of the screen regardless of the idle time setting You can turn grouping on and off and set the idle time when CS SS is set to None don t care Clock Polarity Polarity and Chip Select Active State Active These items are the same as those of the SPI B...

Page 199: ...al notation Only for four wire systems 1 If delay cancel Delay Cancel is set to OFF they are based on the trigger point 2 The first 16 bytes are displayed You can press the Detail soft key to view all of the data of the specified analysis numbers Search Setup Search When the wiring system is 3wire the instrument searches Data1 for the specified condition data pattern When the wiring system is 4wir...

Page 200: ...tch source on 2 channel models This item is the same as the trigger of a user defined serial bus signal Bit Rate Bit Rate The instrument samples the data source at the specified bit rate Set the bit rate when the clock is OFF Selectable Range 1000 bps to 50 Mbps Setting resolution 0 001 kbps for 1 000 kbps to 99 999 kbps 0 01 kbps for 100 00 kbps to 999 99 kbps 0 1 kbps for 1 Mbps to 9999 9 kbps 1...

Page 201: ...splays the histograms Source Waveform Trace Select the source waveform from the waveforms below The available settings vary depending on the model CH1 to CH4 Math1 to Math4 Source Axis Type Selects the data axis that you want to count the frequency for Vertical Vertical axis Horizontal Time axis Range Setup Range Setup Source Window Range Selects the window that you want to count the frequency in ...

Page 202: ...he source axis is horizontal Cursor1 II Cursor2 II In the range of 4 divisions of the time axis Measurement Items Item The instrument measures the values of the items listed below that you select Peak Peak value Max Maximum value Min Minimum value Mean Mean value σ Standard deviation of the histogram Median Median Integ σ Percentage of values that fall within σ Integ 2σ Percentage of values that f...

Page 203: ...eskew the transfer time difference between the two signals and then measure analysis items and power measurement items To use this feature you need to connect a deskew signal source along with the probe beforehand We recommend that you use the following YOKOGAWA products when you deskew the signals Deskew signal source 701936 Passive probe 701937 Differential probe 700924 701921 701926 701927 Curr...

Page 204: ...e of the probe attenuation ratios CH1 or CH3 and one of the voltage to current conversion ratios CH2 or CH4 listed below CH1 CH3 0 001 1 0 002 1 0 005 1 0 01 1 0 02 1 0 05 1 0 1 1 0 2 1 0 5 1 1 1 2 1 5 1 10 1 20 1 50 1 100 1 200 1 500 1 1000 1 2000 1 CH2 CH4 0 001 A 1 V 0 002 A 1 V 0 005 A 1 V 0 01 A 1 V 0 02 A 1 V 0 05 A 1 V 0 1 A 1 V 0 2 A 1 V 0 5 A 1 V 1 A 1 V 2 A 1 V 5 A 1 V 10 A 1 V 20 A 1 V ...

Page 205: ...the loss calculation period on the basis of the device s on resistance RDS on VCE sat x I The loss over the loss calculation period on the basis of the device s collector emitter saturation voltage Vce SAT If the type of loss is set to RDS on x I2 or VCE sat x I the total loss is measured according to the following Total loss Loss in the loss calculation period loss in the switching period U CH1 I...

Page 206: ...oes below the I Level after the waveform passes the middle point of the loss calculation period to the point where the waveform first goes above the I Level after the waveform passes the middle point between the relevant loss calculation period and the next loss calculation period The instrument assumes that the current and loss are zero Switching period The period other than the loss calculation ...

Page 207: ...rm parameters Measurement Items Item Setup You can select which items to measure from the list below Loss Wp Turn On loss over the switching period positive On loss over the loss calculation period Turn Off loss over the switching period negative Total loss over the switching period positive and negative sum of the losses in the loss calculation period The definition of loss is different depending...

Page 208: ...nge2 The measurement time period is the range that can be extracted as a cycle within the range specified by T Range1 and T Range2 Displaying Measured Results When measurement results are displayed on the screen symbols that indicate the measurement item and measurement channel are shown in front of the measured values as shown below Example PTotal C1 PTotal Sum of active power C1 Voltage channel ...

Page 209: ...e for the switching loss analysis feature Turning the VT Waveform Display On or Off VT Display The SOA is displayed in the XY window Use this setting to choose whether or not to display VT waveforms with the XY waveforms OFF The VT waveform display window does not appear ON The VT waveform display window appears Cursor Measurement Cursor You can display two cursors on both the X and Y axes and mea...

Page 210: ...A or less of current per cycle The figure below provides a broad description of the applicable devices However while the instrument can perform harmonic analysis on single phase devices it cannot perform analysis on three phase devices Electrical and electronic equipment having an input current up to 16 A per phase Balanced three phase equipment Household appliances excluding equipment identified ...

Page 211: ...z 10 periods of data 60 Hz power supply 55 Hz to 65 Hz 12 periods of data Probe Setup ProbeSetup The channel selection probe attenuation voltage to current conversion ratio and deskew settings are the same as those for the switching loss analysis feature Analysis Start Point Start Point Set the analysis start point Power Supply Voltage of the EUT System Voltage Set the power supply voltage of the ...

Page 212: ...ratio limit is also used in the evaluation Harmonic Grouping Grouping There are three types of IEC harmonic groupings The method for calculating the magnitude of the harmonic rms values is different for each grouping No grouping OFF Only components whose frequencies are integer multiples of the fundamental wave are considered harmonics Interharmonic components are not included Grouping Type 1 Type...

Page 213: ...torage device The extension is csv Analysis Number List No The line corresponding to the number you select is highlighted The instrument can perform harmonic analysis on single phase devices but not on three phase devices IEC 61000 4 7 specifies that the measured data be smoothed using a first order filter for 1 5 seconds but the harmonics analysis results on the instrument are instantaneous value...

Page 214: ... integral measurement items and automatically measured waveform parameter items If measured Joule integral values are not displayed reduce the number of automatically measured waveform parameter items Source Window Time Range Specify the range over which to measure the Joule integral by selecting one of the following windows Main Entire main window Zoom1 Entire Zoom1 window Zoom2 Entire Zoom2 wind...

Page 215: ...Auto Ranging Executes auto scaling Use this feature when the waveform amplitude changes greatly and the waveform is difficult to view You can also set the display range by specifying the vertical center I2 t value Center of the display area and the I2 t value per division Sensitivity In Joule integral measurement you can compute statistics in three different modes Continuous Cycle and History 17 P...

Page 216: ...f the power measurement modes is set to ON cycle mode of automated measurement of waveform parameters is set to OFF Probe Settings Probe Setup The pairs of voltage and current input channels are fixed Refer to the table below and apply the appropriate voltage and current signals Power Measurement Voltage Input Channel Current Input Channel Power Measurement1 CH1 CH2 Power Measurement2 CH3 CH4 Prob...

Page 217: ...of waveform parameters items related to power can be measured automatically Set the measurement item for each input channel Input channels and Measurement Items Item Setup Measurement Items of Voltage Input Channels CH1 and CH3 Voltage U pk U pk Up p Urms Udc Uac Umn Urmn Average frequency Avg Freq Power S P Q Impedance Z Power factor λ Watt hours Wp Wp Wp Abs Wp For details on how each item is de...

Page 218: ...the input channels as percentages or voltages This feature is the same as the reference level of the automated measurement of waveform parameters If you set the reference levels using percentages the distal mesial and proximal voltage values are determined depending on the waveform If you want to set reference levels that do not change based on the waveform set the levels as voltage values Changin...

Page 219: ...e statistics Count This item is the same as that of the automated measurement of waveform parameters Source Window Time Range Specify the range over which to measure the power by selecting one of the following windows Main Main window Zoom1 Zoom1 window Zoom2 Zoom2 window Measurement Time Period T Range1 T Range2 Set the measurement time period in the source window 17 Power Supply Analysis Feature...

Page 220: ...ecified area Average You can linearly average history waveforms in a specified range and display the averaged waveform Calculation Cursor Measurement Automated Measurement Statistical Processing and FFT You can perform calculations cursor measurement automated measurement of waveform parameters or FFT analysis on the history waveform that you specified with Select No You can also calculate statist...

Page 221: ... When you stop controlling the jog shuttle only the waveform of the record number indicated in Select No will be highlighted Maximum Number of Waveform Acquisitions Maximum number of history waveforms that can be stored in the acquisition memory The number of history waveforms that can be stored varies depending on the selected record length and the installed memory options as follows Record Lengt...

Page 222: ...on the 2 channel model Search conditions 1 to 4 are shared with the reference conditions of GO NO GO determination Search Criterion Condition Sets whether the source waveform must be in or out of the search range to be detected IN The source waveform is detected when it is in the search range OUT The source waveform is detected when it is out of the search range Source Waveform Trace You can set t...

Page 223: ... mode you cannot use the history feature If you stop waveform acquisition the instrument only displays waveforms that have been acquired completely Notes about Recalling Data Using the History Feature Waveform acquisition stops when you display the History menu You cannot display history waveforms while waveform acquisition is in progress You can start waveform acquisition when the History menu is...

Page 224: ...ted to the instrument through one of the USB 2 0 ports Network Printer Network A printer on the network that the instrument is connected to You must configure the network printer in advance File File You can save screen captures to files in PNG BMP and JPEG formats Multiple Destinations Multi You can perform the following operations at the same time Print and save screen captures to multiple desti...

Page 225: ...n Information You can print the instrument settings that were used at the time the waveform was acquired Printing on a USB Printer USB You can print screen captures on a printer connected to one of the USB ports USB Ports The instrument has a Type A USB port on the front panel as well as a Type A USB port and a Type B USB port on the rear panel Connect the printer to one of the standard type A por...

Page 226: ...the same as that described in Saving Screen Captures to Files File Hardcopy Hardcopy The entire instrument screen is printed Normal Normal The waveform area of the instrument screen is printed The menu is not printed When the results of cursor measurements and automated measurement of waveform parameters are displayed they are output below the waveform area Printer Type Format You can only use HP ...

Page 227: ... waveform area of the instrument screen is printed The menu is not printed When the results of cursor measurements and automated measurement of waveform parameters are displayed they are output below the waveform area Printer Type Format The following printers can be used with the instrument HP InkJet HP inkjet printers HP Laser HP laser printers Color Color ON Prints using the same colors as the ...

Page 228: ...hen the results of cursor measurements and automated measurement of waveform parameters are displayed they are output below the waveform area Example When color data is ON Gray Measured Results Wide Wide The same screen capture as Normal mode but with the waveform time axis magnified 2 times When the results of cursor measurements and automated measurement of waveform parameters are displayed they...

Page 229: ...els Background Transparent or Opaque Background For PNG format you can save the waveform display area with a transparent background This feature is convenient when you want to compare waveforms by overlaying screen captures on the PC Normal Saves data without changing the background opaque Transparent Saves data by making the background transparent Including Setting Information Information When sa...

Page 230: ...aptures to files File Print screen captures on the built in printer BuiltIn Print screen captures on a USB printer USB Print screen captures on a network printer Network Save waveform data Waveform If you are saving both screen capture and waveform data at the same time they are saved to the last destination specified using the file list When you are executing action on trigger or GO NO GO determi...

Page 231: ...he Getting Started Guide IM DLM3054 03EN USB Storage Device USB USB1 A USB storage device that is connected to the instrument s USB port USB2 0 mass storage devices compatible with USB Mass Storage Class Ver 1 1 can be connected to the instrument Network Drive Network A storage device on the network If a Ethernet port is available you can connect the instrument to an Ethernet network and use a net...

Page 232: ...e the figure below The file name specified using the File Name setting is not used Time in units of 100 ms 0 ms 0000 100 ms 0001 59 min 59 s 900 ms 0RRZ Hour 0 0 hour 9 9 hour 10 A hour 23 N 1st 1 10th A 31st V Jan 1 Oct A Nov B Dec C 2000 0 2010 A 2035 Z Y M D H Date2 The file name is the date and time down to ms when the file is saved The file name specified using the File Name setting is not us...

Page 233: ...ile in ASCII format You can use the file to analyze waveforms on your PC You cannot load this type of data into the instrument If the record length is less than or equal to 1 25 Mpoints all of the waveform data can be saved If the record length is more than 1 25 Mpoints the data is compressed and saved Data size Record length Mpoint 10 bytes point the number of traces from 1 to 8 The extension is ...

Page 234: ...orm data is P P compressed so that the number of data points is equal to the specified number and then saved Data that has been compressed and saved cannot be loaded into the instrument regardless of the format data in ASCII format data with time information in ASCII format or data in binary format Saving Data through Sampling Decim The data is sampled decimated so that the number of data points i...

Page 235: ... Bus SENT UART I2 C SPI later in this manual You can specify file names in the same way as with waveform data Screen Captures Screen Image You can save the displayed screen image to a file in PNG BMP or JPEG Data Format Format PNG The extension is png The file size is approximately 50 KB when you save a black and white screen capture and approximately 200 KB when you save a color screen capture BM...

Page 236: ...ension is csv CSV files are text files that contain data separated by commas They are used to convert data between spreadsheet and database applications The maximum number of previous values that you can save is equal to 100000 number of items that are turned on Data size in bytes Number of measured items 15 number of history waveforms Output Example Analysis Type WaveParameter Model Name DLM3000 ...

Page 237: ...2 6 12E 01 5 00E 02 6 14E 01 6 00E 02 6 02E 01 7 00E 02 6 58E 01 8 00E 02 6 18E 01 9 00E 02 6 53E 01 When Freq Info is set to ON Histogram Histogram You can save the histogram of the waveform or the waveform parameter that was specified using Hist1 or Hist2 List of Timestamps History List You can save the list of history waveform information record number trigger time and the difference between th...

Page 238: ... 60 bytes The data size is for reference It is not strictly warranted Use this as reference for saving data Output Example Amount of time from the trigger position to the start of frame Analysis number Analysis Type SerialBus FlexRay Model Name DLM3000 Model Version No Time ms S D IND ID Len CC Data Information 7 0 358624 S 1111 4 4 5 01 02 03 04 05 06 07 08 6 0 307424 S 0000 5 4 5 00 00 00 00 00 ...

Page 239: ...2 1 FE 2263 Y 2 4 9516 Data 100 3 FF 01 A4 6C6E Y 3 7 5356 Data 00A 2 01 02 4A24 Y CAN FD Output Example ID in hexadecimal ACK slot state Y ACK present N ACK not present Error information Stuff Error Fixed Stuff Error CRC Error SC Seq ESI Error Passive etc Amount of time from the trigger position to the start of frame Frame type Data is displayed for CAN Analysis number DLC in hexadecimal Data in ...

Page 240: ... file in CSV format The extension is csv Analysis results of up to 10 000 frames can be saved Data size The number of frames in analysis 4 900 bytes The data size is for reference It is not strictly warranted Use this as reference for saving data Output Example Analysis Type SerialBus CXPI Model Name DLM3000 Model Version No Time ms ID DLC W S CT Data CRC Information 3 52 4732 3 L16 0 0 00 11 22 3...

Page 241: ...up to 100000 frames can be saved Data size Fast CH or Both list The number of frames in analysis results 4 100 bytes Slow CH list The number of frames in analysis results 4 30 bytes The data size is for reference It is not strictly warranted Use this as reference for saving data Output example of a Fast CH or Both List Amount of time from the trigger position to the start of frame Time duration of...

Page 242: ...aved Data size The number of frames in analysis results 4 40 bytes The data size is for reference It is not strictly warranted Use this as reference for saving data Output Example when grouping is set to ON Data1 in hexadecimal Amount of time from the start point Analysis number Analysis Type SerialBus UART Model Name DLM3000 Model Version No Time ms Data HEX Data ASCII Information 4 209 948 00 80...

Page 243: ...ension is csv Analysis results of up to 300000 bytes can be saved Data size The number of bytes in the analysis results 2 4 125 bytes The data size is for reference It is not strictly warranted Use this as reference for saving data Output Example Data1 in hexadecimal Amount of time from the start point Analysis number Analysis Type SerialBus SPI Model Name DLM3000 Model Version No Time ms Data 6 0...

Page 244: ... Data into Reference Waveforms Load to Ref1 Math1 Load to Ref2 Math2 Load to Ref3 Math3 Load toRef4 Math4 You can load the waveform data of the specified file as a reference waveform Setup data is not loaded Reference waveforms are used to compare current waveforms to waveforms saved in the past and to perform computation You can display reference waveforms by setting the computation mode on the M...

Page 245: ... you created on the instrument into internal storage locations Zone1 to Zone4 You can load zones that have been saved to zwf files using this instrument and polygonal zones that have been saved to msk files using the dedicated software application These zones are used for GO NO GO determination and other purposes Snapshot Waveforms Snap You can load snp files that contain snapshot waveforms that y...

Page 246: ...device Network Network storage device Selecting Multiple Files or Folders Select Selects or unselects all of the files or folders in the list You can also only select or unselect the highlighted files or folders Making Folders Directories New Folder You can make folders Copying and Moving Files and Folders Copy Move You can copy or move selected files and folders to other storage media or folders ...

Page 247: ...Deleting is also not allowed OFF r w File protection is off for the selected file The file has read and write access Selecting Files All Set All Reset and Set Reset Selects or unselects all of the files or folders in the list You can also only select or unselect the highlighted files or folders You can format the internal storage Flash_Mem by pressing UTIL and then using Storage Manager on the Sys...

Page 248: ... as an FTP server to a network You can connect to the instrument from a PC on the same network and retrieve waveform data Mail Mail The action on trigger or GO NO GO action can be set to mail transmission Network Drive Net Drive You can save waveform data and setup data to a network drive Network Printer Net Print You can specify a network printer for printing screen captures SNTP The instrument c...

Page 249: ... specify the host by name instead of by IP address Set the domain name and the DNS server address 0 0 0 0 by default For details consult your network administrator DNS Servers DNS Server1 DNS Server2 You can specify up to two DNS server addresses primary and secondary If querying fails with the primary DNS server the secondary DNS server is automatically used to find the mapping of the host name a...

Page 250: ...d to access the instrument from a PC The characters that you can use are all the ASCII characters on the keyboard You can use up to 15 characters Timeout Timeout If a connection cannot be established between the instrument and the PC within the amount of time specified here the instrument aborts the connection process Selectable range 0 s to 3600 s To apply the settings that you specified press Se...

Page 251: ... it disconnects from the mail server Selectable range 1 s to 60 s User Authentication POP3 before SMTP Before you send an e mail POP3 user authentication is performed User Authentication On and Off ON Authentication is performed before e mails are sent OFF Authentication is not performed before e mails are sent Encryption type U P The authentication data is sent in plain text APOP The authenticati...

Page 252: ...are all the ASCII characters on the keyboard You can use up to 14 characters Passive Mode Passive Turn FTP passive mode on or off In passive mode the FTP client sets the port number for data transfer Enable passive mode when you have set an external FTP server as a network drive or when you are accessing an FTP server through a firewall Timeout Timeout If the instrument cannot transfer files for a...

Page 253: ...ally adjust its clock when it is turned on SNTP Server SNTP Server Specify the IP address of the SNTP server that the instrument will use In a network with a DNS server you can specify the host name and domain name instead of the IP address Timeout Timeout If the instrument cannot connect to the SNTP server for a certain amount of time it aborts the operation Selectable range 1 s to 60 s Executing...

Page 254: ...t the logic channels Waveforms Displayed before the Execution of Auto Setup Waveforms that were displayed before you execute auto setup will be cleared Signals That Auto Setup Can Be Applied To You can use auto setup for the following types of input signals Simple repeating signals whose frequency is 50 Hz or higher Absolute input voltage Signals whose maximum value is at least approx 20 mV at 1 1...

Page 255: ...do the reset operation if you clear the Undo menu item by switching to a different setup menu or pressing the ESC key To Reset All Settings to Their Default Values While holding down the RESET key turn the power switch on All settings except the date and time settings display on off setting will be reset and the setup data stored in internal memory will be reset to their factory default values Sna...

Page 256: ...nts Calibration is automatically performed for the settings listed above when the power switch is ON Notes about Calibration Allow the instrument to warm up for at least 30 minutes before you execute calibration If you execute calibration immediately after power on the calibrated values may drift due to temperature changes or other environmental changes Execute calibration in a stable temperature ...

Page 257: ... USB TMC Test and Measurement Class to control the instrument from a PC To connect the instrument to a PC through the USB port carry out the following procedure Install YOKOGAWA USB driver in your PC Do not use USB drivers or software supplied by other companies Mass Storage Mass Storage You can access the instrument from a Windows 7 Windows 8 1 or Windows 10 PC and read data from the instrument s...

Page 258: ...e bus turned on To connect multiple devices use a star or daisy chain configuration Loop and parallel configurations are not allowed Network Network Connects this Instrument to a PC using Ethernet VXI 11 VXI 11 Select whether to allow access to the instrument using VXI 11 ON Allows access OFF Denies access Socket Interface Socket Select whether to allow access to the instrument using the socket in...

Page 259: ...e Date Time Sets the date and time Time Difference from Greenwich Mean Time Time Diff GMT Set the time difference between the region where you are using the instrument and Greenwich Mean Time Selectable range Set the time difference in the range of 12 hours 00 minutes to 13 hours 00 minutes For example Japan standard time is ahead of GMT by 9 hours In this case set Time Hour to 9 and Minute to 00 ...

Page 260: ...r measurement values Font Size Font Size You can set the size of text for displaying automated measurement values of waveform parameters and cursor measurements Small Small font size Large Large font size Number of Rows outside the Waveform Area Max Rows Set the number of rows outside the waveform area for displaying automated measurement values of waveform parameters and cursor measurement values...

Page 261: ...n turn off the backlight When the backlight is off you can turn it back on by pressing a key Offset Cancel Offset Cancel You can select whether to apply the offset that you specified for observing analog signals to the various measured values For details see Offset Offset in chapter 1 Vertical Axis Analog Signal Delay Cancel Delay Cancel You can select whether to apply the specified trigger delay ...

Page 262: ...after purchase Install the options after you have purchased the license keys for them Options Available to 4 channel Models G02 User defined computation G03 Power supply analysis F01 UART I2 C SPI trigger analysis F02 CAN CAN FD LIN trigger analysis F03 FlexRay trigger analysis F04 SENT trigger analysis F05 CXPI trigger analysis The SUFFIX suffix code inscribed in the name plate on the instrument ...

Page 263: ...operating properly if you can enter the specified characters Printer Test Printer Tests whether or not the optional built in printer is operating properly The built in printer is operating properly if the print density is correct If an error occurs the print density will not be correct Accuracy is a service test item Under normal circumstances you do not need to perform these tests Executing a Tes...

Page 264: ...sponds to a Single X Data Point 1 3 Start point End point S0 Area S S0 X axis Y 0 X axis Y 0 Area S S0 End point Start point S0 2 4 End point Start point S0 Area S S0 S1 X axis Y 0 X axis Y 0 Area S S0 Start point End point S0 When the Waveform Extends into the Negative Side X axis Y 0 S0 S1 Start point End point When Multiple Y Data Corresponds to X Data X axis Y 0 S0 Start point End point Area S...

Page 265: ...urve S0 Start point Area S S0 Area enclosed by a curve connecting the start and end points End point Loop Tracing a Figure Eight Area S S0 S1 Loop Tracing a Spiral Area S 2 S0 S1 The number of overlaps varies according to the number of loops End point S0 S1 Start point End point Start point S0 Waveform S1 Appendix ...

Page 266: ...ghPass 4 4 4 4 3 The cutoff percentage is with respect to the sample rate Filter Response Filter Pass band Ripple Attenuation Slope Attenuation at the Stop band Phase FIR 0 3 dB 40 dB at 1 oct Lowpass 40 dB Linear phase 40 dB at 1 oct Highpass Linear phase IIR 0 dB 5 dB at 1 6 oct Lowpass Non linear phase 20dB at 1oct Highpass Non linear phase Examples of Filter Frequency Responses f Frequency Hz ...

Page 267: ...l is transformed the signal is first transformed into the frequency domain through Fourier transform Next the phase of each frequency component is shifted by 90 degrees if the frequency is positive and 90 degrees if the frequency is negative Lastly taking the inverse Fourier transform completes the Hilbert transform Example The Hilbert transform can be used to analyze an envelope waveform AM ampli...

Page 268: ...ng time x0 to xn The derivative and integrated values corresponding to these data points are computed as follows Differentiation DIFF Point xk fk fk 2 8fk 1 8fk 1 fk 2 h Dx is the sampling interval sec example When 5 kHz h 200 10 6 1 12h Integration INTEG Point x0 I0 0 Point x1 I1 f0 f1 h Point x2 I2 f0 f1 h f1 f2 h I1 f1 f2 Point xn In In 1 1 2 1 2 1 2 1 2 fn 1 fn h 1 2 Binary Conversion BIN Perf...

Page 269: ...om a falling edge to the next falling edge PWXX From a rising or falling edge to the next rising or falling edge FV The inverse of PWHH DUTYH Duty ratio of the high side of each period of the specified waveform DUTYL Duty ratio of the low side of each period of the specified waveform Example 1 When the Interval Is Set to PWHH Waveform to be computed Upper threshold level t1 t1 t2 t2 t3 t3 Computed...

Page 270: ...GMAG 20 log R2 I2 2 Log magnitude reference 0 dB 1 Vrms Power Spectrum The power spectrum expresses the power squared value of each frequency component included in the measured signal It is determined by taking the product of the linear spectrum and its complex conjugate It does not contain phase information This instrument can determine the following spectra Item Formula Computation Bandwidth PS ...

Page 271: ...rom the following equation the transfer function can be defined as the ratio of the cross spectrum of the input and output Gyx and the input power spectrum Gxx Transfer function Gy Gx Gy Gx Gx Gx Gyx Gxx Ryx jIyx Rx2 Ix2 The instrument can determine the following items Item Formula Computation Real part TF REAL Ryx Rx2 Ix2 Imaginary part TF IMAG Iyx Rx2 Ix2 Bandwidth TF MAG Ryx2 Iyx2 Rx2 Ix2 Log m...

Page 272: ...pared to the flattop window However the flattop window has a higher level of accuracy When the waveform being analyzed is a continuous signal consider the above characteristics in selecting the proper window to be applied T T T T t Sine wave Time window Integral Power spectrum Rectangular Hanning Rectangular Hanning Flat top W t u t u t T U t Step function W t 0 5 0 5cos 2 W t 0 54 0 46cos 2 T T F...

Page 273: ... Each waveform s Y axis unit this has no effect on the data SampleRate The sample rate at the time of waveform acquisition HResolution Each waveform s X axis conversion coefficient HResolution X axis value HResolution Data No 1 HOffset HOffset Each waveform s X axis conversion coefficient HOffset X axis value HResolution Data No 1 HOffset HUnit Each waveform s X axis unit this has no effect on the...

Page 274: ...t 111 Instrument control through the Ethernet interface 1024 1025 UDP Port Numbers Port Number Description Used For 67 Bootstrap Protocol Server DHCP client 68 Bootstrap Protocol Client listen port 111 Instrument control through the Ethernet interface 123 Network Time Protocol SNTP client The port number when FTP passive mode is disabled When FTP passive mode is enabled you can set any port number...

Page 275: ...ed mean value Irmn Active power P W Reactive power Q var Power factor λ Watt hours Wh Wp Wp Wp Abs Wp Ampere hours Ah q q q Abs q Average frequency Avg Freq Hz q is the sum of positive and negative Idc ampere hours q is the sum of positive Idc ampere hours q is the sum of negative Idc ampere hours Abs q is the sum of q and q the sum of absolute ampere hours Wp is the sum of positive and negative w...

Page 276: ...nd of the last piece of data of the relevant frame Every Slow CH End of S C of the last fast channel of the relevant slow channel Slow CH ID Data Error Successive CAL Pulses Preferred Option Trigger point End of S C of the succeeding frame Detected point End of S C of the relevant frame Successive CAL Pulses Option 2 End of S C of the relevant frame Nibble Number Trigger point End of S C of the su...

Page 277: ...n If you are using an older version you will not be able to use all the features described in this manual To view the firmware version press the Overview soft key on the UTILITY menu and check Firmware Version on the Overview screen that is displayed Version Suffix Code New Features Manual Edition Number 1 00 and later Standard New 1st Edition Appendix ...

Page 278: ... 12 area XY 8 2 assignment 2 3 2 5 A trigger 4 78 attenuation constant 6 3 attenuation ratio 1 3 attributes file 20 17 auto calibration 22 3 auto level mode 4 1 automated measurement of waveform parameters saving results of 20 6 automatic zero adjustment 1 4 automatic zero adjustment of current probes 1 4 auto measurement notes on 12 13 auto measurement on off 12 1 auto mode 4 1 auto scaling 9 7 a...

Page 279: ...surement of waveform parameters 12 5 cycle trace 12 8 cyclic statistical processing 12 8 D Page Data1 Data2 FlexRay 4 26 Data1 Data2 SPI 4 70 data bit rate CAN FD 4 41 data CAN 4 31 data CAN FD 15 12 Data CAN FD 4 39 data CXPI 4 50 15 21 data format UART 4 63 data frame CAN 4 31 4 36 data frame CAN FD 4 39 4 43 15 12 data I2C 4 66 data length CXPI 4 49 15 19 data LIN 4 46 data loading 20 14 data p...

Page 280: ...ormat CAN 4 31 frame format CAN FD 4 39 15 11 frame information 4 49 15 20 frame skip 4 75 frame start 4 24 4 25 framing CXPI 4 49 15 19 FTP server 21 3 fundamental frequency 17 8 fundamental wave 17 8 fundamental waveform changing 5 5 Fund Current 17 10 G Page general call 4 67 GO NO GO determination 5 3 GO NO GO determination execution 5 3 GO NO GO determination notes on 5 7 GP IB 22 5 gradation...

Page 281: ... marker cursor 11 3 marker cursor FFT 10 4 marker display format 11 3 mark search 14 7 measurement location indicator 12 5 measurement source waveform auto measurement 12 1 measurement source waveform cursor 11 1 measurement source window 12 1 measurement time period 12 1 MeasureSetup FFT 10 4 MeasureSetup histogram 12 11 MeasureSetup waveform histogram 16 2 MeasureSetup XY 8 2 message signal 4 33...

Page 282: ...4 remote control 22 4 remote frame CAN 4 31 4 36 remote frame CAN FD 4 39 4 44 15 12 repetitive 6 4 repetitive sampling mode 6 4 replay history 18 4 replay speed 18 4 resolution 4 77 restart 12 7 restart statistical processing 12 7 Result Window 14 7 rise fall time trigger 4 14 rms current 17 16 rms voltage 17 15 roll mode display 3 1 rotary 9 5 rotary count 9 5 RUN STOP 6 5 RUN STOP key when disa...

Page 283: ...t trigger 4 17 TimeRange auto measurement 12 1 TimeRange FFT 10 3 time scale 3 1 time scale record length sample rate relationship between 6 4 timestamps list of 18 2 20 7 timestamps saving the list of 20 7 time window 10 3 total loss 17 3 touch panel 22 10 T Range1 T Range2 12 1 transfer function App 8 transfer time difference correcting 17 1 trend display SENT 15 25 trend display trend 15 4 Tren...

Page 284: ...ters automated measurement of 12 2 waveform vertical position 1 2 waveform zone 5 4 waveform zone confirmation 5 5 waveform zones and polygonal zones loading 20 15 waveform zones saving 20 6 Window OR trigger 4 20 window trigger 4 18 window type 7 1 wiring system 4 69 X Page X axis and Y axis source waveforms 8 1 XY waveform display 8 1 XY window 7 1 Z Page Zone No 5 4 zoom link 13 3 zoom link tur...

Reviews: