


Revision 7.10
2/28/2012
3.
Ensure that the newly specified Data Server name is now showing in the Data Server
combobox.
4.
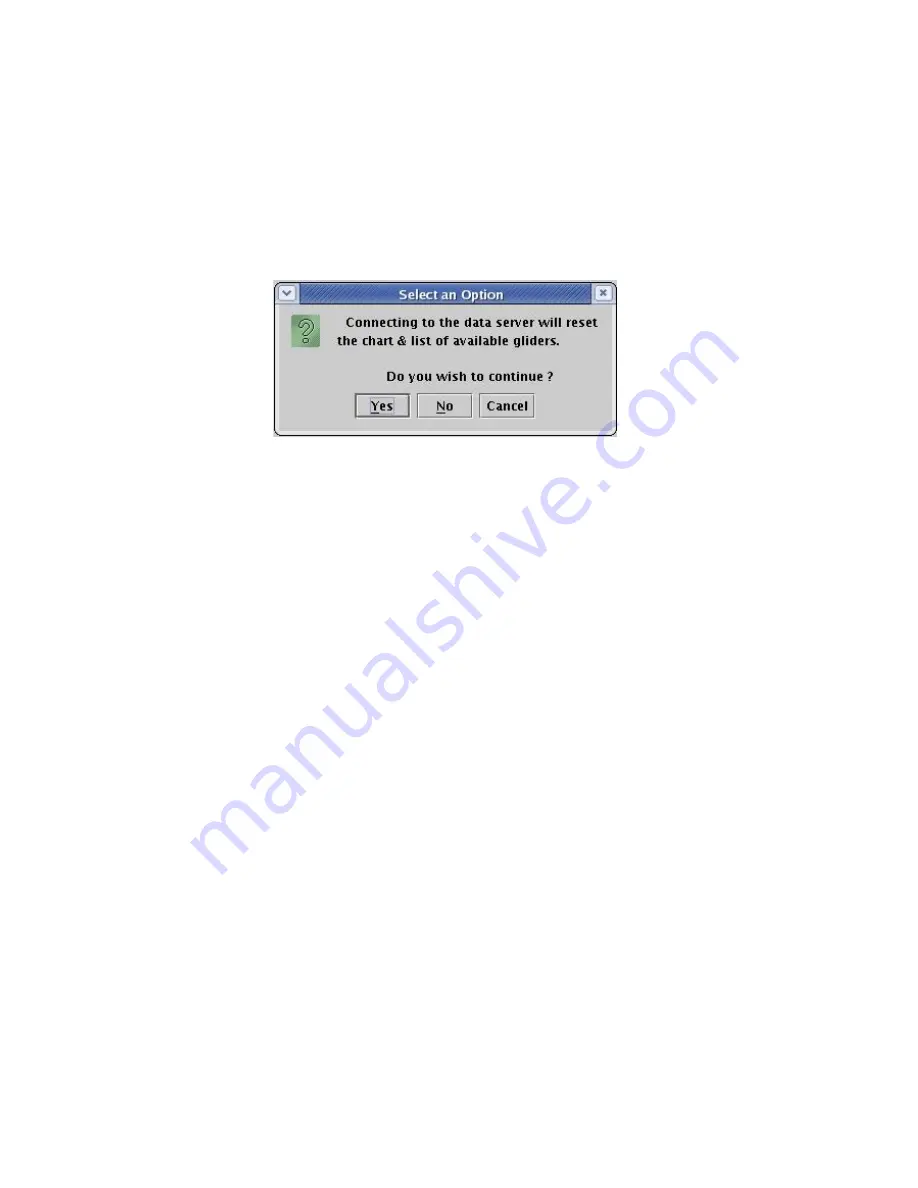
Select Server/Connect to Data Server, from the Data Server’s menu bar. A dialog
(similar to that shown in Figure 83) will appear. Selecting
Yes
will then attempt to
connect the Data Visualizer to the specified Data Server.
Figure 83. Connecting to a Data Server
Note that the Data Visualizer can be connected to any previously added Data Server
appearing in the Data Server combobox by following steps 3 & 4 above. If the
connection is successful a confirmation dialog will appear, and the text
Connected to
<server> using port <port>
will appear below the display area, indicating the selected
server and port number. Also, the Glider combobox will be updated to list all gliders
known to the Data Server. If the connection is not successful, a warning dialog will
appear. The dialog in Figure 83 simply warns that connecting to the new Data Server
will reset the list of gliders shown in the Glider combobox to those known by the newly
connected Data Server.
The Data Visualizer can only be connected to one Data Server at a time, so connecting
to Data Server
B
while still connected to Data Server
A
will simply drop the connection
to Data Server
A
.
Any previously added Data Server can be removed by selecting the site in the Data
Server combobox, and selecting Server/Delete Data Server from the Data Visualizer’s
menu bar.
8.5 Displaying Sensor Data
Sensor data (such as glider depth, battery voltage etc.) is displayed on the graph yaxis,
while the xaxis displays only time, longitude or distance flown by the glider. For
Page 109 of 228


