


Drive Optimization with HMI Advanced
14.6 Trace function
Manual
532
Commissioning Manual, 05/2008, 6FC5397–4CP10–4BA0
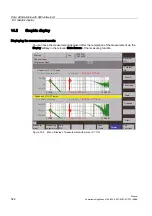
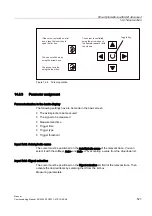
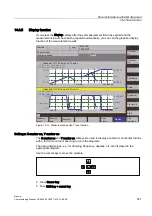
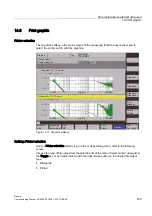
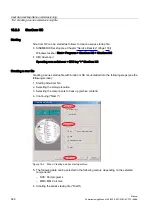
Softkeys: 2. Marker, Zoom, Preview
If a marker is active, a 2nd line is shown in the diagram via the 2nd marker with the softkey
These two lines define the range that you can then have displayed over the entire display
range by pressing softkey Zoom.
The process of zooming a range (marker ON, 2nd marker, zoom) can be repeated as often
as desired until the maximum size of representation is reached.
Use the softkey Fullscreen to switch the display of the diagrams back to their original size.
Note
X and Y markers can be active at a time.
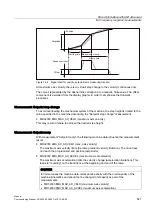
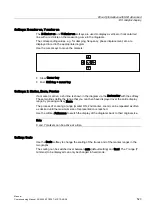
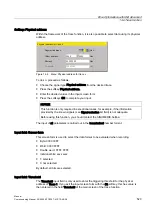
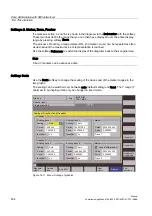
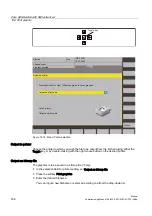
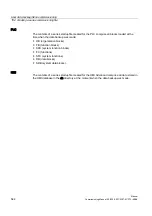
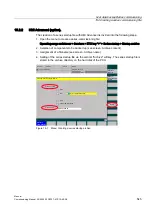
Softkey: Scale
Use the Scale softkey to change the scaling of the traces and of the marker ranges in the
two graphs.
The scaling can be switched over between auto (default setting) and fixed. The Y range (Y
min/max) to be displayed can only be changed in fixed mode.
-RJ
?03)',5
7(6703)
)LOH
IXQFWLRQV
'LVSOD\
529
&KDQQHOUHVHW
3URJUDPDERUWHG
6WDUWXS
0HDVXUH
PHQW
$[LV0'
8VHU
YLHZV
*UDSKLFV
*UDSKLFV
*UDSKLFV
*UDSKLFV
;PD[
;PLQ
<PD[
<PLQ
<PD[
<PLQ
;PD[
;PLQ
<PD[
<PLQ
<PD[
<PLQ
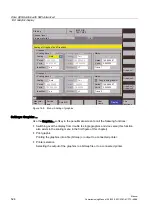
6FDOLQJRI*UDSKLFVDQG*UDSKLFV
6FDOLQJ
6FDOLQJ
6FDOLQJ
6FDOLQJ
$XWR
$XWR
$XWR
$XWR
,GHQWLILHU
,GHQWLILHU
,GHQWLILHU
,GHQWLILHU
RQ
RQ
RQ
RQ
7UDFH
7UDFH
6HUYLFH
D[LV
6FDOLQJWUDFH
*UDSKLFV
*UDSKLFV
6FDOLQJWUDFH
6FDOLQJWUDFH
6FDOLQJWUDFH
0DUNHU
0DUNHU
&RXSOHZLWKJUDSKLF
Figure 14-11 Menu: Scaling of graphics