


PIN-M-02 DPMRA01.A Service Manual
Copyright © Pinssar (Aust) Pty Ltd 2019. The PINSSAR logo is a registered trademark of Pinssar Pty Ltd
Page 76 of
96
11 HMI Introduction
11.1 Red Lion HMI
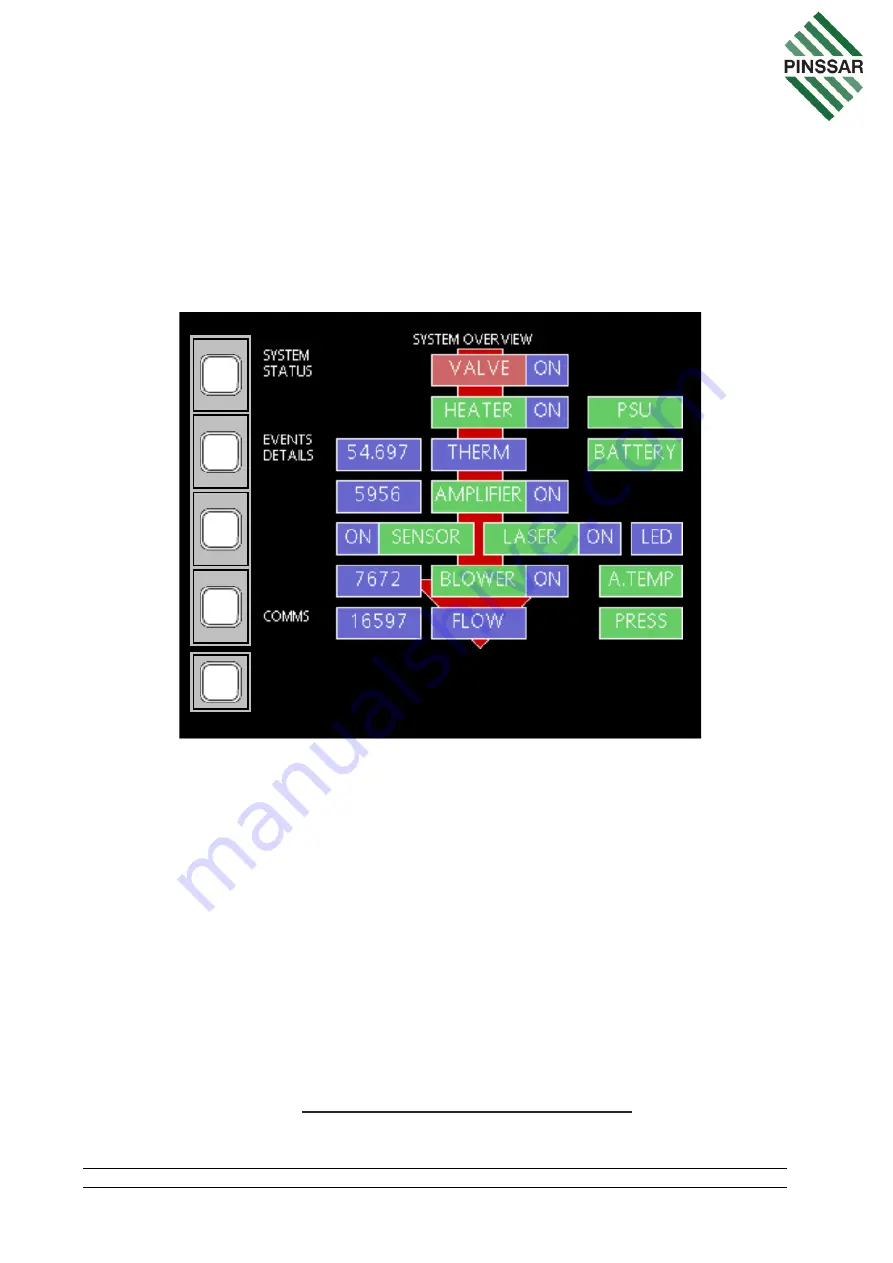
The HMI interface has a SYSTEM OVERVIEW page that displays the status of all
components within the DPM Reader. Each component is represented by a coloured
box. Green is used to indicate healthy status and Red to indicate unhealthy status. Each
box is also a page link to the
corresponding component’s control and status page.
F
IGURE
51
-
SYSTEM
OVERVIEW
-
HMI
L
ANDING PAGE
Note: The bottom left button on the HMI window is the back button used to return to
the SYSTEM OVERVIEW page as shown by the red arrow on the left.
Technicians can use the SYSTEM OVERVIEW page (Figure 51) to start their
diagnostics of issues with the DPM Reader. There are 13 component pages used to
assist technicians in identifying and rectifying problems with the Reader.
The following steps are used to open the HMI window page on a computer on the same
network as the DPM Reader.
1. Open a web browser on your computer such as Internet Explorer.
2. Locate the URL (Uniform Resource Locator) box and type in the web address
of the HMI inside the DPM Reader (the Red Lion):
http:/(IP Address of DPM Reader):8080