X - R i t e e X a c t 2
28
Density Functions
The functions determine what measurement values are displayed after a measurement. The available functions
are specific to density measurements.
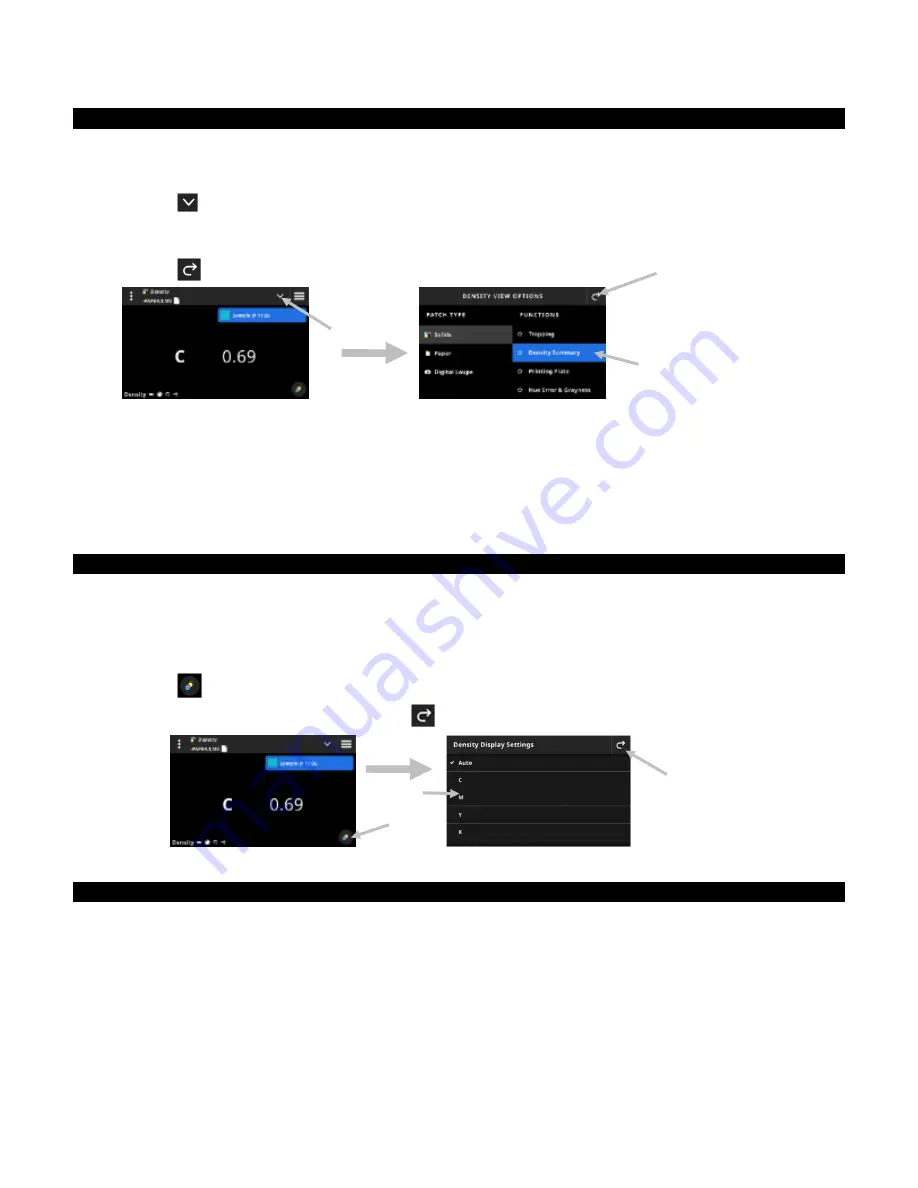
To select a solids function:
1. Tap the
icon (1) next to the function name at the top of the screen to open the Density View Options.
2. Tap the desired solids function (2) for your data. Additional functions can be accessed by swiping up on the
screen. A table with the available functions is shown below.
3. Tap the
icon (3) to return to the Density screen.
Available Density Functions
All Densities
Trapping
Density Density
Summary
Tone Value
Printing Plate
Contrast
Hue Error & Grayness
Density Display Settings
This option is used to choose a density display option for density functions. Options are: Auto, C, M, Y, K, or
Spot. Selecting Auto displays the dominate process color measured. Selecting C, M, Y, or K displays the density
value for the measured sample. For Spot selection, the result is given as the density value at the wavelength of
maximum density for the spectral curve.
To select a density display setting:
1. Tap the
icon (1) at the bottom right of the screen to open the Density Display Settings.
2. Tap the desired option (2) and then tap the
icon (3) to return to the data view screen.
Measurement Procedure
The measurement workflow is different depending on the active function. Many functions, for example Density
or All Densities require a single measurement of a patch. The display shows the measurement values according
to the selected function. Other functions like Tone Value and Trapping require multiple measurements in a
workflow.
The Density Summary function which will walk the user through measuring Paper, Solid and Tint patches and
show all the results on one screen.
1. Activate targeting mode by pressing the Measure button once
2. Select Density (1) to select the measurement tool you want to use.
(1)
(2)
(3)
(1)
(2)
(3)
Summary of Contents for X-Rite eXact 2
Page 1: ...User Guide ...
Page 2: ......


