APPLIED OPERATIONS
/Changing the Image Display Method
OPERATION INSTRUCTIONS
2 - 2 0 0
Page
2-5-2 Editing the LUT (Look Up Table)
An original LUT can be created by editing an existing LUT.
2-5-2-1 LUT Graph Editing According to Colors
1. Display the image window of the image that you want to edit the LUT.
2. Click the <LUT> button in the toolbar. The [Color Tool] dialog box appears as shown in
Fig. 2-64.
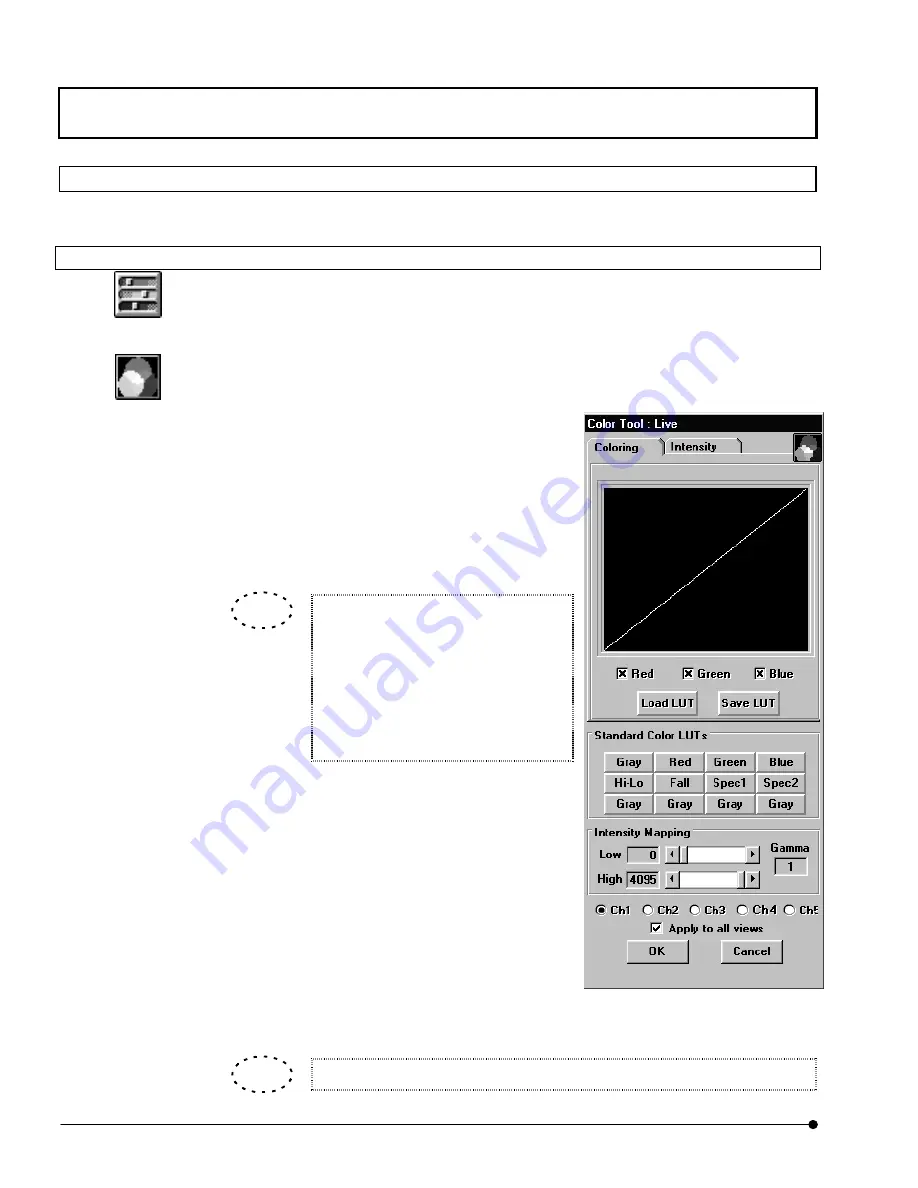
3. Click the <Graph display> button on the top right of the [Color Tool] dialog box. The
dialog box shows the LUT intensity graph.
4. Select the LUT color to be edited by checking
the check boxes below the graph in the [Color
LUT Tool] group box.
5. Set the range of intensity graph application using
the [Low] and [High] scales in the [Intensity
Mapping] group box.
Double-clicked the [Low] scale, [High]
scale and [Gamma] text box, they are
reset to the default values (“0” with the
[Low] scale, “4095” or “255” with the
[High] scale and “1.0” with the [Gamma]
text box).
6. The inclination of the graph in the [Color LUT
Tool] group box can be changed by dragging an
end of the graph line. The selected LUT will
immediately be applied to the image in the
image window.
7. If it is required to save the edited LUT in a file,
click the <Save LUT> button in the [Color LUT
Tool] group box.
To load a previously saved LUT, click <Load LUT>.
<LUT> button
<Graph display> button
Fig. 2-65 LUT Intensity Graph
Display
TIP
TIP


