184
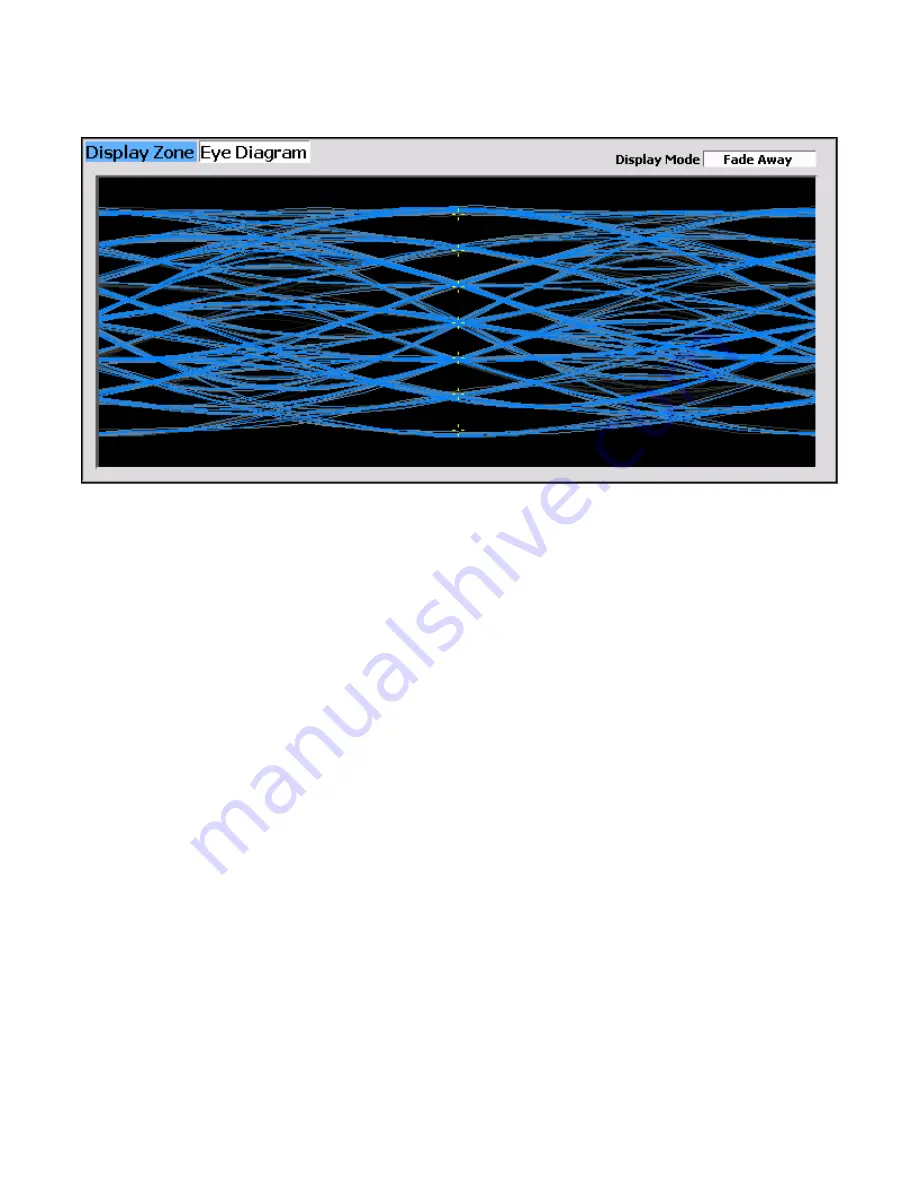
Figure 2.2.7.9.1.3-2 Eye Diagram of HCPM and Display Mode Fade Away
Distribution Plot (Display Zone selection)
This selection displays a graph showing the distribution of symbol deviations of the received signal
grouped into frequency bins, i.e. the frequency offset versus the rate of occurrence of that frequency (~10
Hz for HDQPSK; ~12 Hz for HCPM). Each plot consists of about two seconds of the most current data
available.
HDQPSK consists of four symbol values (-3, -1, +1, +3) at proportional carrier deviations; see Table
2.2.7.9.1.2-1. The four ideal symbol deviations are labeled at gridlines with additional gridlines half way
between them which divide the plot into four equal regions and mark the thresholds where symbol
decisions change from one to the other. For example, in low power conditions noise may cause a symbol’s
deviation to appear in the adjacent region thus causing a bit error.
Be sure that the Modulation Type in the P25 II test zone is set for the expected receive signal in order to
establish the appropriate horizontal range and symbol timing used to sample the deviation appropriately.
Sampling is at symbol times for HDQPSK but halfway between symbol times for HCPM. ISI inherent in
the modulations causes some overshoot exhibited by groups being further from center and having multiple
peaks.
All distribution amounts are displayed by automatic adjustment of the vertical axis scaling to show the
full amount of symbols falling into each bin. Distribution amounts are the percentage of the number of
symbols whose deviation falls within that point’s frequency bin based on the number of symbols in the
analysis population. The better a signal is, the more symbols will actually land in the ideal bin to increase
its percentage. Deviations that are past the graph edge limits (e.g. for noise if there is no signal) are
collected and shown in the bin at the limit.
Summary of Contents for R8100 SERIES
Page 19: ...19 Figure 2 1 2 Left and Right Sides of the R8100...
Page 164: ...164 Figure 2 2 7 7 5 Power Profile Frame with Markers...
Page 224: ...224 Figure 3 2 9 6 1 Submenu after pressing Options soft key in the Settings menu...
Page 243: ...243 PTC Test in Monitor Mode Eye Diagram Display...
Page 244: ...244 Power Profile Display Linear and Circular Constellation Displays...
Page 245: ...245 Symbol Distribution Plot...


