Profiler User Guide
4-5
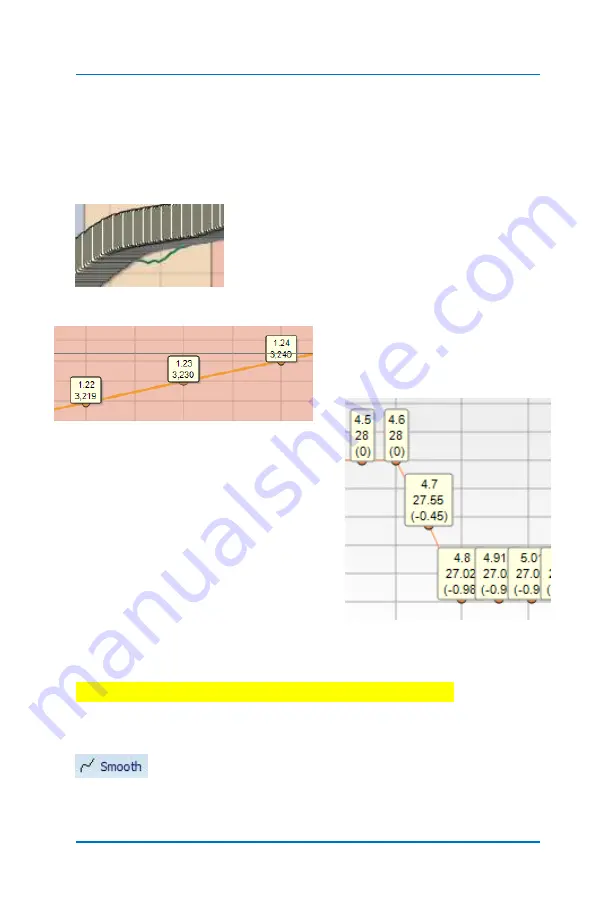
values at each data point. In the Timing window, marks show time
and timing values. Marks can be toggled on and off for both the
Profile window as well as the Timing window areas of the screen.
Profile
Marks
On. Display shows both Time
& Driveshaft RPM along the Profile curve.
Notice in full screen view there are so many
that you must use
zoom
to be able to see the
individual marks and data.
Zoom view of the
Marks
.
Timing -
Marks
on. Display shows
Time and Timing settings at that point
in time. Each Mark displays both the
time line and timing degrees for each
data point
These are the Timing Marks using Zoom
which makes it easier to see. Notice that
when the timing was ramped down one
degree, the data points in-between reflect the exact timing, in this case
at 4.7 seconds the retard was -.45 degree.
The Profiler gives you precise control over engine timing!
When a grouping of Grips is selected, the
Smooth
function becomes available. This is a powerful tool. If
an imported driveshaft curve has some spikes, dips etc., the Smooth
Summary of Contents for Profiler
Page 1: ......
Page 76: ...Profiler User Guide 4 30...
Page 124: ...Profiler User Guide Appendix 15 6 Click Advanced Options 7 Click Windows Startup Settings...
Page 138: ...Profiler User Guide Appendix 29...
Page 139: ...Profiler User Guide Appendix 30...
Page 140: ...Profiler User Guide Appendix 31...
Page 141: ...Profiler User Guide Appendix 32...
Page 142: ...Profiler User Guide Appendix 33...
Page 144: ...Profiler User Guide Appendix 35...
Page 145: ...Profiler User Guide Appendix 36...
Page 146: ...Profiler User Guide Appendix 37...
Page 147: ...Profiler User Guide Appendix 38...
Page 148: ...Profiler User Guide Appendix 39...
Page 149: ...Profiler User Guide Appendix 40...
Page 150: ...Profiler User Guide Appendix 41...
Page 151: ...Profiler User Guide Appendix 42...
Page 152: ...Profiler User Guide Appendix 43...


