20050401
k
k
k
k
k
t
Tests
u
u
u
u
u
t
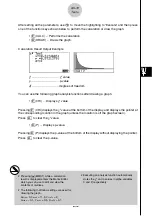
Test Common Functions
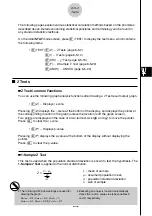
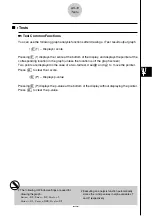
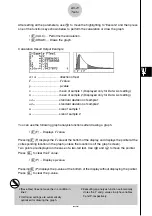
You can use the following graph analysis functions after drawing a
t
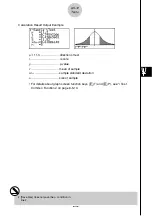
Test result output graph.
•
1
(T) ... Displays
t
score.
Pressing
1
(T) displays the
t
score at the bottom of the display, and displays the pointer at the
corresponding location in the graph (unless the location is off the graph screen).
Two points are displayed in the case of a two-tail test. Use
d
and
e
to move the pointer.
Press
J
to clear the
t
score.
•
2
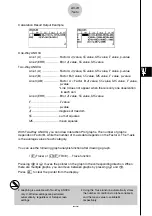
(P) ... Displays p-value.
Pressing
2
(P) displays the p-value at the bottom of the display without displaying the pointer.
Press
J
to clear the p-value.
6-5-10
Tests
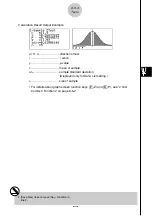
# The following V-Window settings are used for
drawing the graph.
Xmin
= –3.2,
Xmax
= 3.2,
Xscale
= 1,
Ymin
= –0.1,
Ymax
= 0.45,
Yscale
= 0.1
# Executing an analysis function automatically
stores the
t
and p values in alpha variables T
and P, respectively.
Summary of Contents for fx-9860G AU PLUS
Page 1: ...fx 9860G AU User s Guide E http edu casio com ...
Page 2: ...Important Please keep your manual and all information handy for future reference ...
Page 27: ...20050401 1 1 Keys 1 1 1 Keys ...
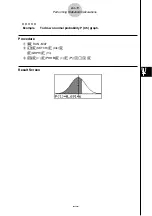
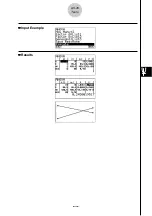
Page 335: ...20050401 u u u u u Input Example u u u u u Results 6 5 25 Tests ...
Page 361: ...20050401 Calculation Result Output Example p F distribution probability 6 7 15 Distribution ...
Page 435: ...20050401 8 8 2 Program Library egcw w ww w ...
Page 437: ...20050401 8 8 4 Program Library Example 1 Example 2 fw baw bf w fw baw ca w ...
Page 439: ...20050401 8 8 6 Program Library wba wb w w d ...
Page 441: ...20050401 8 8 8 Program Library dw fcde wfcde wfcde fcde w daw w 20070101 ...
Page 443: ...20050401 8 8 10 Program Library b awaw bwaw aw x d w ...
Page 590: ...CASIO COMPUTER CO LTD 6 2 Hon machi 1 chome Shibuya ku Tokyo 151 8543 Japan SA0701 E ...

