20050401
○ ○ ○ ○ ○
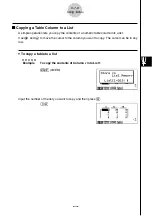
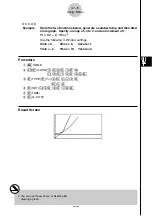
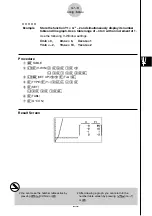
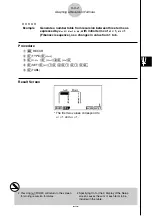
Example
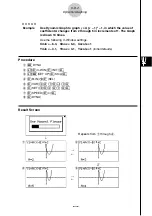
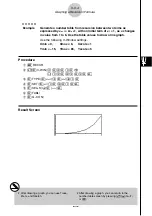
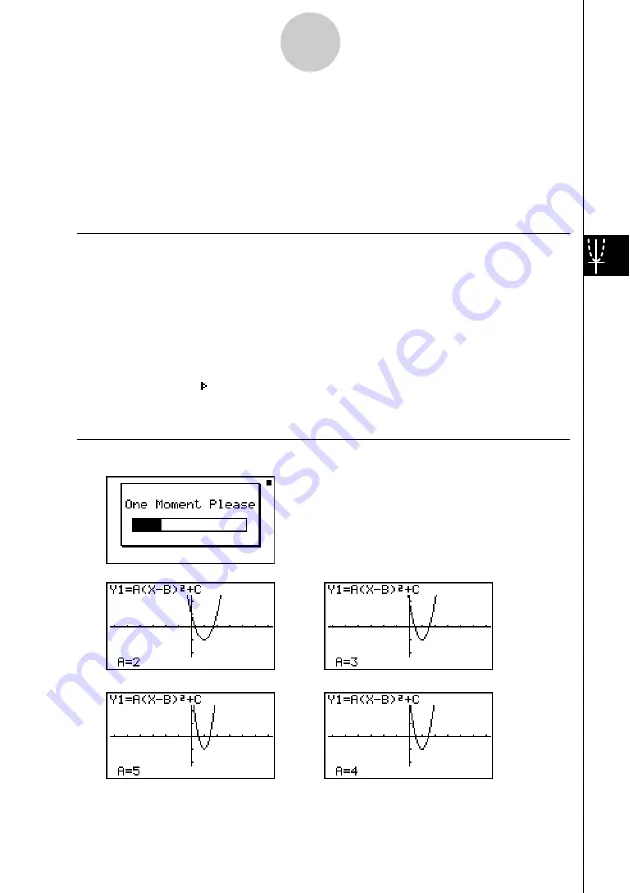
Use Dynamic Graph to graph
y
= A (
x
– 1)
2
– 1, in which the value of
coefficient A changes from 2 through 5 in increments of 1. The Graph
is drawn 10 times.
Use the following V-Window settings.
Xmin = –6.3, Xmax = 6.3, Xscale = 1
Ymin = –3.1, Ymax = 3.1, Yscale = 1
(initial defaults)
Procedure
1
m
DYNA
2
!3
(V-WIN)
1
(INIT)
J
3
!m
(SET UP)
2
(Stop)
J
4
5
(B-IN)
c
1
(SEL)
5
4
(VAR)
c
w
b
w-
b
w
6
2
(SET)
c
w
f
w
b
wJ
7
3
(SPEED)
3
( )
J
8
6
(DYNA)
Result Screen
↓
→
←
↓↑
→
←
5-8-2
Dynamic Graphing
1
4
2
3
Repeats from
1
through
4
.
Summary of Contents for fx-9860G AU PLUS
Page 1: ...fx 9860G AU User s Guide E http edu casio com ...
Page 2: ...Important Please keep your manual and all information handy for future reference ...
Page 27: ...20050401 1 1 Keys 1 1 1 Keys ...
Page 335: ...20050401 u u u u u Input Example u u u u u Results 6 5 25 Tests ...
Page 361: ...20050401 Calculation Result Output Example p F distribution probability 6 7 15 Distribution ...
Page 435: ...20050401 8 8 2 Program Library egcw w ww w ...
Page 437: ...20050401 8 8 4 Program Library Example 1 Example 2 fw baw bf w fw baw ca w ...
Page 439: ...20050401 8 8 6 Program Library wba wb w w d ...
Page 441: ...20050401 8 8 8 Program Library dw fcde wfcde wfcde fcde w daw w 20070101 ...
Page 443: ...20050401 8 8 10 Program Library b awaw bwaw aw x d w ...
Page 590: ...CASIO COMPUTER CO LTD 6 2 Hon machi 1 chome Shibuya ku Tokyo 151 8543 Japan SA0701 E ...

