20050401
k
k
k
k
k
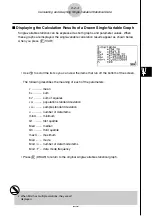
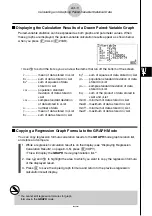
Displaying the Calculation Results of a Drawn Paired-Variable Graph
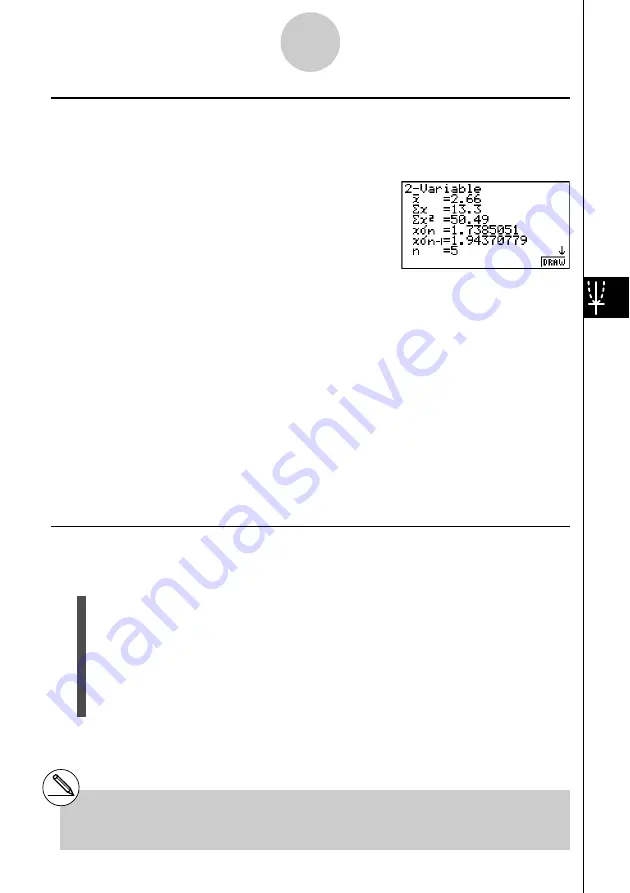
Paired-variable statistics can be expressed as both graphs and parameter values. When
these graphs are displayed, the paired-variable calculation results appear as shown below
when you press
1
(CALC)
1
(2VAR).
• Use
c
to scroll the list so you can view the items that run off the bottom of the screen.
o
............... mean of data stored in
x
List
Σ
x
............. sum of data stored in
x
List
Σ
x
2
........... sum of squares of data
stored in
x
List
x
σ
n
............ population standard
deviation of data stored in
x
List
x
σ
n
-1
.......... sample standard deviation
of data stored in
x
List
n
............... number of data
p
............... mean of data stored in
y
List
Σ
y
............. sum of data stored in
y
List
k
k
k
k
k
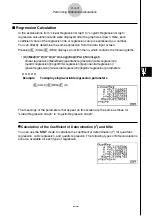
Copying a Regression Graph Formula to the GRAPH Mode
You can copy regression formula calculation results to the
GRAPH
mode graph relation list,
and store and compare.
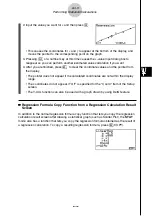
1. While a regression calculation result is on the display (see “Displaying Regression
Calculation Results” on page 6-3-5), press
5
(COPY).
• This will display the
GRAPH
mode graph relation list.*
1
2. Use
f
and
c
to highlight the area to which you want to copy the regression formula
of the displayed result.
3. Press
w
to save the copied graph formula and return to the previous regression
calculation result display.
6-3-11
Calculating and Graphing Paired-Variable Statistical Data
Σ
y
2
...... sum of squares of data stored in
y
List
y
σ
n
...... population standard deviation of data
stored in
y
List
y
σ
n
-1
.... sample standard deviation of data
stored in
y
List
Σ
xy .....
sum of the product of data stored in
x
List and
y
List
minX ... minimum of data stored in
x
List
maxX .. maximum of data stored in
x
List
minY ... minimum of data stored in
y
List
maxY .. maximum of data stored in
y
List
*
1
You cannot edit regression formulas for graph
formulas in the
GRAPH
mode.
Summary of Contents for fx-9860G AU PLUS
Page 1: ...fx 9860G AU User s Guide E http edu casio com ...
Page 2: ...Important Please keep your manual and all information handy for future reference ...
Page 27: ...20050401 1 1 Keys 1 1 1 Keys ...
Page 335: ...20050401 u u u u u Input Example u u u u u Results 6 5 25 Tests ...
Page 361: ...20050401 Calculation Result Output Example p F distribution probability 6 7 15 Distribution ...
Page 435: ...20050401 8 8 2 Program Library egcw w ww w ...
Page 437: ...20050401 8 8 4 Program Library Example 1 Example 2 fw baw bf w fw baw ca w ...
Page 439: ...20050401 8 8 6 Program Library wba wb w w d ...
Page 441: ...20050401 8 8 8 Program Library dw fcde wfcde wfcde fcde w daw w 20070101 ...
Page 443: ...20050401 8 8 10 Program Library b awaw bwaw aw x d w ...
Page 590: ...CASIO COMPUTER CO LTD 6 2 Hon machi 1 chome Shibuya ku Tokyo 151 8543 Japan SA0701 E ...

