


Using Help
|
Contents
|
Index
Back
391
Adobe Illustrator Help
Using Graphs
Using Help
|
Contents
|
Index
Back
391
You can also rotate the design in the Graph Column dialog legend box. By default, the
design is rotated to appear horizontal in the legend box. You can turn this option off so
that the design appears vertically in the legend box.
Rotated graph design compared to unrotated design
Creating a graph design
Creating a graph design is similar to creating a pattern. (For design ideas that you might
use when creating graphs, see
“Creating and working with patterns” on page 206
.)
When you create a design or use a design in a file, the design is saved. To use that design
in another file, either open the file in which you created the design or use the Window >
Swatch Libraries > Other Library command and choose the file whose designs you want
to import. (When the designs are imported, you will see the colors, gradients, and patterns
in the new file, but the actual graph designs will only be visible in the Graph Design
dialog box.)
To create a graph design:
1
Create a rectangle as the backmost object in the design. The rectangle represents the
boundary of the graph design.
2
Paint the rectangle as desired, or fill and stroke it with None so that it is invisible.
Copy and paste the smallest column in your graph to use it as the bounding rectangle
for your design.
3
Create the design using any of the drawing tools, or position an existing design in front
of the rectangle.
4
To display column totals with the graph design, skip to that procedure later in this
section.
5
Using the selection tool , select the entire design, including the rectangle.
6
Choose Object > Group to group the design.
7
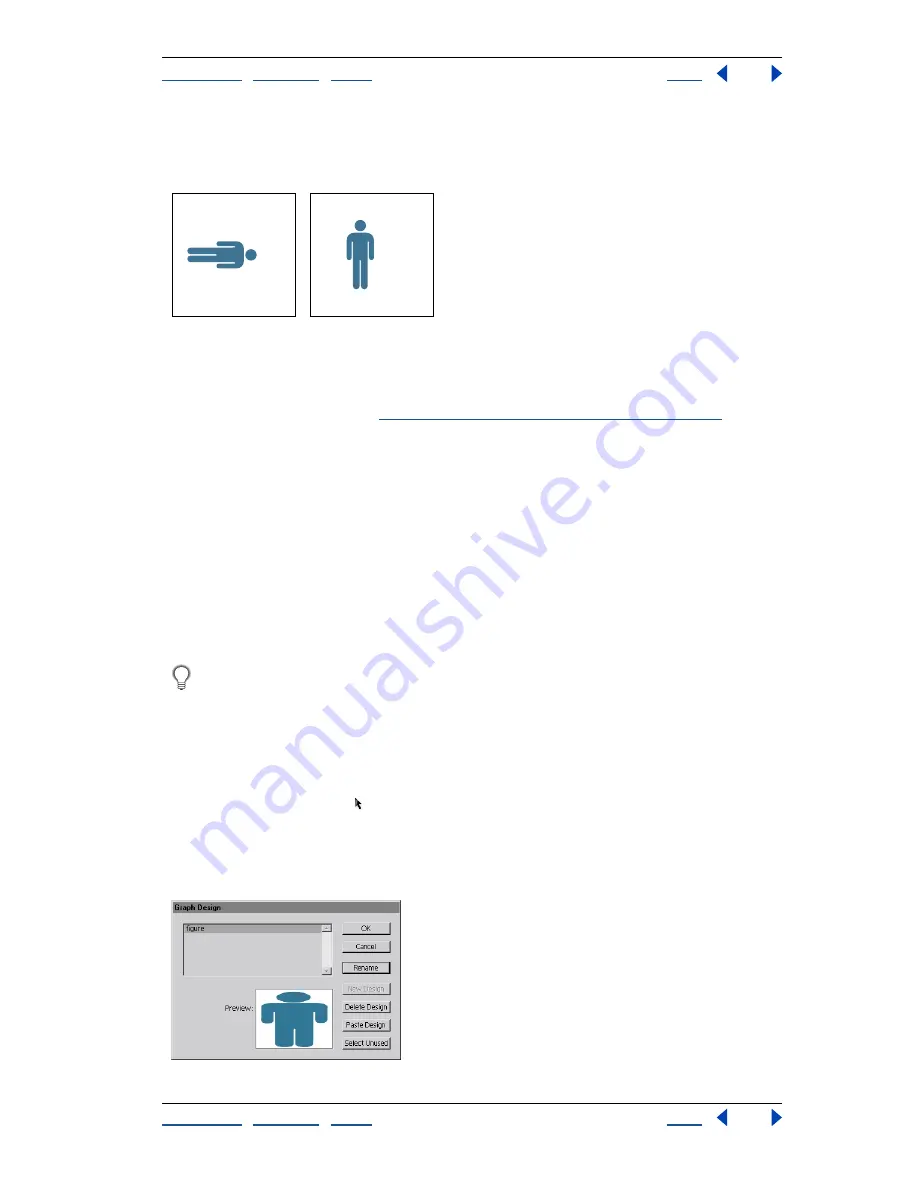
Choose Object > Graph > Design.
8
Click New Design. A preview of the selected design appears.
Graph Design dialog box
A
A


