AB Sciex QTRAP 4500 LC/MS/MS system System User'S Manual Download Page 35

Operating Instructions — Hardware

System User Guide

4500 Series of Instruments

RUO-IDV-05-0264-A

 35 of 138

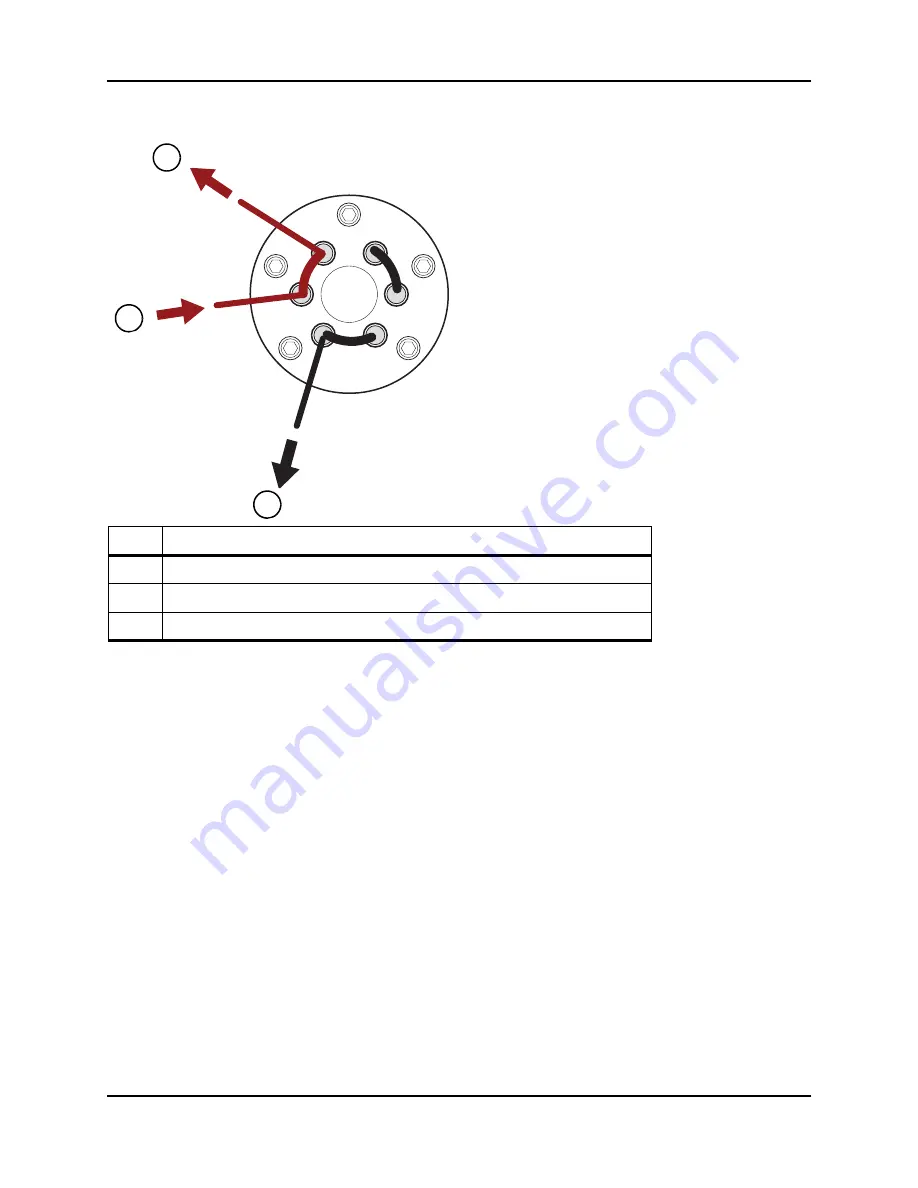
Figure 4-8 Diverter Valve—Diverter Mode Position B

Item Description

1

To mass spectrometer

2

From column

3

Waste out

3

6

1

4

6

5

2

3

1

2

3

Summary of Contents for QTRAP 4500 LC/MS/MS system

Page 1: ...AB SCIEX 4500 Series of Instruments System User Guide Document Number RUO IDV 05 0264 A Release Date April 2013 ...

Page 2: ... only to designate those manufacturers products as supplied by AB SCIEX for incorporation into its equipment and does not imply any right and or license to use or permit others to use such manufacturers and or their product names as trademarks AB SCIEX warranties are limited to those express warranties provided at the time of sale or license of its products and are AB SCIEX s sole and exclusive re...

Page 3: ... of Instruments RUO IDV 05 0264 A 3 of 138 Revision Log Revision Description Date D5030863 A First release of document March 2012 RUO IDV 05 0264 A Assigned new document number Updated template Applied new content model April 2013 ...

Page 4: ...Revision Log 4500 Series of Instruments System User Guide 4 of 138 RUO IDV 05 0264 A ...

Page 5: ...nd Modification 14 Chapter 2 Hazards Symbols 17 Occupational Health and Safety Symbols 17 Symbols Indicators and Labels 18 Packaging 18 Mass Spectrometer 19 Documentation 20 Chapter 3 Principles of Operation 23 System Overview 23 Panel Symbols 24 Connections 24 Theory of Operation 26 Data Handling 26 Chapter 4 Operating Instructions Hardware 27 Start Up the System 27 Reset the System 27 Shut Down ...

Page 6: ...nt 53 Add a Period 54 Copy an Experiment into a Period 54 Copy an Experiment within a Period 54 Scan Techniques 54 Quadrupole Mode Scan Types 54 LIT Mode Scan Types 55 About Spectral Data Acquisition 56 Parameters 56 Acquisition Method Editor Icons 62 Chapter 9 Operating Instructions Batches 63 Set Queue Options 63 Add Sets and Samples to a Batch 64 Submit a Sample or Set of Samples 66 Change Samp...

Page 7: ...ods 95 About Results Tables 96 Quantitation Methods and Results Tables 96 Create a Method using the Quantitation Method Editor 96 Create a Results Table using the Quantitation Wizard 97 Create a Standard Query 98 Results Table Right Click Menu 101 Peak Review and Manual Integration of Peaks 102 Review Peaks 102 Manually Integrate Peaks 105 Peak Review Right Click Menu 107 Calibration Curves 107 Vi...

Page 8: ...3 Clean the Curtain Plate 124 Clean the Front of the Orifice Plate 124 Put the System Back into Service 125 Empty the Source Exhaust Drain Bottle 125 Storage and Handling 127 Chapter 14 Troubleshooting 129 Appendix A Parameters for 4500 Series Instruments 131 Appendix B Calibration Ions and Solutions 137 ...

Page 9: ...rements General Safety Information To prevent personal injury or system damage read understand and obey all safety precautions warnings in this document and labels on the mass spectrometer These labels are shown with international symbols Failure to heed these warnings could result in serious injury This safety information is intended to supplement federal state or provincial and local environment...

Page 10: ...1 WEEE Waste Electrical and Electronic Equipment Directive 2002 96 EEC United States Electromagnetic Interference FCC Part 15 Class A This equipment has been tested and found to comply with the limits for a Class A digital device pursuant to Part 15 of the FCC Federal Communications Commission Compliance Rules These limits are designed to provide reasonable protection against harmful interference ...

Page 11: ...ss spectrometer must be positioned to permit access to the mains supply connector to disconnect the device Chemical Precautions Determine which chemicals may have been used in the system prior to service and regular maintenance Refer to Safety Data Sheets for the health and safety precautions that must be followed with chemicals Work in a well ventilated area Always wear assigned personal protecti...

Page 12: ...firmation is received from AB SCIEX that it will not present a hazard This is not an exhaustive list Organic solvents MS grade acetonitrile up to 100 MS grade methanol up to 100 Isopropanol up to 100 Tetrahydrofuran up to 100 Toluene and other aromatic solvents up to 100 Hexanes up to 100 HPLC grade or higher water up to 100 Buffers Ammonium Acetate less than 1 Ammonium Formate less than 1 Phospha...

Page 13: ...trometer might cause gases to be discharged into the exhaust stream Under these conditions inadequate ventilation might result in serious injury WARNING Toxic Chemical Hazard Biohazard Radiation Hazard Make sure that the mass spectrometer is connected to the local exhaust system and ducted to control hazardous emissions The system should only be used in a well ventilated laboratory environment in ...

Page 14: ...d Personnel After installing the system the AB SCIEX Field Service Employee FSE uses the Customer Familiarization Checklist to familiarize the customer with system operation cleaning and basic maintenance Only qualified AB SCIEX personnel shall install and service the equipment Only personnel qualified by AB SCIEX shall operate and maintain the equipment Contact an FSE for more information Equipme...

Page 15: ...cation or operation of the system might cause personal injury and equipment damage and might void the warranty Erroneous data may be generated if the system is operating outside the recommended environmental conditions or with unauthorized modifications Contact an AB SCIEX representative for more information on servicing the system ...

Page 16: ...Operational Precautions and Limitations 4500 Series of Instruments System User Guide 16 of 138 RUO IDV 05 0264 A ...

Page 17: ...bols This section describes some occupational health and safety symbols found in the documentation and laboratory environment Table 2 1 Electrical Hazard Symbols Safety Symbol Description Electrical Shock Hazard Table 2 2 Chemical Hazard Symbols Safety Symbol Description Biohazard Explosion Hazard Toxic Chemical Hazard Table 2 3 Mechanical Hazard Symbols Safety Symbol Description Hot Surface Hazar...

Page 18: ... Symbols Safety Symbol Description Pressurized Gas Hazard Table 2 5 Labels on the Mass Spectrometer Shipping Materials External Labels Definition Action Tilt Indicator Indicates whether the container was tipped or mishandled Write on the Bill of Lading and check for damage Any claims for tipping require a notation Table 2 3 Mechanical Hazard Symbols Continued Safety Symbol Description ...

Page 19: ...SIDE REFER SERVICING TO QUALIFIED PERSONNEL EN61326 1 2006 CLASS A GROUP 1 ISM EQUIPMENT This ISM device complies with Canadian ICES 001 Cet appareil ISM est conforme à la norme NMB 001 du Canada FCC Compliance This device complies with Part 15 of the FCC Rules Operation is subject to the following conditions 1 this device may not cause harmful interference and 2 this device must accept any interf...

Page 20: ...ments Minimum of six persons required to safely lift this equipment Consult operating instructions Follow operating instructions mandatory Alternating Current High voltage Electrical Shock Hazard On Mains supply Off Mains supply Protective Earth ground V Volts voltage A Amperes current DANGER Danger signifies an action which leads to severe injury or death Table 2 6 Labels on the Mass Spectrometer...

Page 21: ...ns are not followed WARNING Warning signifies an operation that could cause personal injury if precautions are not followed Tip A tip provides useful information that helps apply the techniques and procedures in the text for a specific need and provides shortcuts but is not essential to the completion of a procedure i Note A note emphasizes significant information in a procedure or description ...

Page 22: ...Hazards Symbols 4500 Series of Instruments System User Guide 22 of 138 RUO IDV 05 0264 A ...

Page 23: ...he ion source a diverter valve and the optional NanoSpray ion source monitors Figure 3 1 Front View Item Description For more information refer to 1 Panel symbols Table 3 1 on page 24 2 Nanospray ion source monitors optional NanoSpray Ion Source Operator Guide available from the ion source documentation CD or from the AB SCIEX web site at www absciex com 3 Syringe pump Adjust the Integrated Syring...

Page 24: ...oSpray ion source is installed then the diverter valve is replaced with the DuoSpray valve The diverter valve is installed below the DuoSpray valve For information about the DuoSpray ion source refer to the DuoSpray Ion Source Operator Guide available from the ion source documentation CD or from the AB SCIEX web site at www absciex com Table 3 1 Panel Symbols LED Color Name Description Green Power...

Page 25: ...on page 27 6 Mains supply connection Refer to Start Up the System on page 27 or Shut Down the System on page 28 7 Mass spectrometer switch Up On Down Off Refer to Start Up the System on page 27 or Shut Down the System on page 28 8 Aux I O connection Refer to the Peripheral Devices Setup Guide 9 Ethernet connection connects the mass spectrometer and the computer Contact an FSE 10 Vent button Refer ...

Page 26: ...y of an ion is increased through collisions with gas molecules to the point that molecular bonds break creating product ions This technique allows users to design experiments that measure the m z of product ions to determine the composition of the parent ions After passing through the Q2 collision cell the ions enter the Q3 quadrupole for additional filtering and then enter the detector In the det...

Page 27: ...ugged in to the mass spectrometer 4 Make sure that the mass spectrometer and roughing pump AC mains supply cables are plugged into the AC mains supply 5 Make sure that the Ethernet cable is connected to both the mass spectrometer and the computer 6 Turn on the roughing pump The mains switch is located beside the mains supply input connection on the roughing pump 7 Wait 5 minutes then turn on the m...

Page 28: ...ns supply cables from the AC mains supply 10 Unplug the AC mains supply cable from the bulkhead on the left side of the mass spectrometer Adjust the Integrated Syringe Pump Position 1 Press the Release button on the right side of the syringe pump to lower the base and then insert the syringe Make sure that the end of the syringe is flush against the base and that the shaft of the syringe rests in ...

Page 29: ...e automatic syringe stop before the syringe plunger hits the bottom of the glass syringe Figure 4 1 Lowering the Base Item Description 1 Syringe plunger 2 Release button Press to raise or lower the base Figure 4 2 Safety Stop Item Description 1 Automatic syringe stop After the post hits the automatic syringe stop the syringe pump stops 2 1 1 2 3 ...

Page 30: ...e pump to start the flow The green light next to the button illuminates when the syringe pump is in use 2 Post Adjust the height to prevent the syringe plunger from hitting the syringe during sample infusion 3 Post lock screw Tighten the screw after the height of the post is adjusted Figure 4 3 Turning the Side Screws Tip The syringe pump can also be started using the Analyst software in Manual Tu...

Page 31: ...nstructions Hardware System User Guide 4500 Series of Instruments RUO IDV 05 0264 A 31 of 138 Figure 4 4 Syringe Pump Button and LED Item Description 1 Syringe pump status LED 2 Syringe pump on off button A B 1 2 ...

Page 32: ... Diverter Valve in Injector Mode The diverter valve is a two position 6 port valve If you put the valve in Position A Figure 4 5 the sample flows through the external loop When you switch the valve to Position B Figure 4 6 the sample is injected Figure 4 5 Diverter Valve Injector Mode Position A Item Description 1 Sample in 2 Waste out 3 Sample loop 4 Mobile phase in 5 To column 1 4 6 5 2 3 1 2 3 ...

Page 33: ...e System User Guide 4500 Series of Instruments RUO IDV 05 0264 A 33 of 138 Figure 4 6 Diverter Valve Injector Mode Position B Item Description 1 Sample in 2 Waste out 3 Sample loop 4 Mobile phase in 5 To column 1 4 6 5 2 3 1 2 3 4 5 ...

Page 34: ...ies of Instruments System User Guide 34 of 138 RUO IDV 05 0264 A Plumb the Diverter Valve in Diverter Mode Figure 4 7 Diverter Valve Diverter Mode Position A Item Description 1 To mass spectrometer 2 From column 3 Waste out 1 4 6 5 2 3 1 3 2 ...

Page 35: ...s Hardware System User Guide 4500 Series of Instruments RUO IDV 05 0264 A 35 of 138 Figure 4 8 Diverter Valve Diverter Mode Position B Item Description 1 To mass spectrometer 2 From column 3 Waste out 3 6 1 4 6 5 2 3 1 2 3 ...

Page 36: ...Operating Instructions Hardware 4500 Series of Instruments System User Guide 36 of 138 RUO IDV 05 0264 A ...

Page 37: ...meter parameters and calibrating the mass spectrometer to obtain the best sensitivity and performance from the system Table 5 2 Sample Acquisition Workflow Step To do this Find the information in What does it do 1 Create projects to store data Projects and Subprojects on page 45 Before starting an experiment decide where to store the files related to the experiment Using projects and subprojects i...

Page 38: ...de many tools are available for viewing and processing the acquired data Graphs can be customized with peak labels and captions contour plots can be displayed and spectra can be saved in the library Analyze quantitative data Operating Instructions Analyze and Process Quantitative Data on page 95 Use the various quantitative method creation tools in Quantitate mode to analyze the acquired data and ...

Page 39: ...ed during acquisition The devices configured in the active hardware profile and selected in the Add Remove Device Method dialog appear as icons in the Acquisition Method Browser pane Only devices included in the active hardware profile can be used to create acquisition methods For information about setting up the physical connections to the devices refer to the Peripheral Devices Setup Guide For a...

Page 40: ...User Guide 40 of 138 RUO IDV 05 0264 A 3 In the Profile Name field type a name 4 Click Add Device In the Available Devices dialog in the Device Type field Mass Spectrometer is the preset value 5 In the Devices list select the mass spectrometer Figure 6 2 Create New Hardware Profile Dialog ...

Page 41: ...ometer 8 Click Setup Device 9 Optional To configure the mass spectrometer for the integrated syringe pump on the Configuration tab select Use integrated syringe pump Figure 6 3 Available Devices Dialog WARNING Personal Injury Hazard Make sure that the syringe is seated properly in the syringe pump and the automatic syringe pump stop is adjusted properly to avoid damaging or breaking the glass syri...

Page 42: ...tion tab select Use integrated injector diverter valve 11 Select additional features on the Configuration and Communication tabs as required 12 Click OK to return to the Create New Hardware Profile dialog 13 Add and configure each device that is used with the instrument Refer to step 4 on page 43 Figure 6 4 Configuration Tab with Syringe Pump Configured Figure 6 5 Configuration Tab with Diverter V...

Page 43: ...driver required for each device is also installed After the devices are physically connected to the computer configure the device 1 Open the Hardware Configuration Editor 2 In the Hardware Profiles list deactivate the hardware profile 3 Click Edit Profile 4 Click Add Device 5 In the Available Devices dialog in the Device Type list select the device 6 Click OK 7 In the Devices in current profile li...

Page 44: ...15 Click Activate Profile The check mark turns green If a red x is shown then there is an issue with the hardware profile activation For more information refer to Troubleshoot Hardware Profile Activation 16 Click Close Troubleshoot Hardware Profile Activation If a hardware profile fails to become active a dialog appears indicating which device in the profile failed A failed profile may be due to c...

Page 45: ...e power up activities 8 Activate the hardware profile 9 If the issue persists delete the failing profile and then create a new one 10 If the issue persists contact technical support Projects and Subprojects Create Projects and Subprojects To use a subproject structure within a project create the subproject structure when the project is created 1 Click Tools Project Create Project 2 In the Project ...

Page 46: ...ated with this folder configuration 6 Click OK Create Subprojects Subprojects can only be created in a project that has an existing subproject structure 1 On the Project toolbar in the Project list select the project 2 Click Tools Project Create Subproject 3 In the Subproject name box type a name for the subproject or use the existing date 4 Click OK Copy Subprojects A subproject can be copied fro...

Page 47: ...s from the Subproject Source into the Subproject Destination select the Copy Contents check box To copy only the folders in the same structure into the Subproject Destination make sure that the Copy Contents check box is cleared 9 Click Copy Switch Between Projects and Subprojects On the software toolbar from the project list click the required project or subproject Figure 6 8 Project List Item De...

Page 48: ...he Default folder contains folders that are present in new projects and serves as a template for new projects Example Folder The Example folder contains sample methods and data files Users can practice working with the Explore or Quantitate modes using the example data files The example files are sorted into subfolders by mass spectrometer type and application area Back Up the API Instrument Folde...

Page 49: ...tion about using the other instrument performance options refer to the Help 1 In the navigation bar under Tune and Calibrate double click Manual Tuning 2 Run a calibration method and confirm that the TIC is stable and that the peaks of interest are present in the spectrum 3 In the navigation bar under Tune and Calibrate double click Instrument Optimization The Instrument Optimization dialog opens ...

Page 50: ...e scan at the current parameter value when the software results are viewed in interactive mode The Instrument Optimization Decision Plots in the top right graph dynamically show the intensity versus voltage curves of the parameters that are currently being optimized Results Summary The Results Summary is a record of any instrument settings changes that were made by the Instrument Optimization soft...

Page 51: ...Operating Instructions Tune and Calibrate System User Guide 4500 Series of Instruments RUO IDV 05 0264 A 51 of 138 Figure 7 1 Results Summary ...

Page 52: ...Operating Instructions Tune and Calibrate 4500 Series of Instruments System User Guide 52 of 138 RUO IDV 05 0264 A ...

Page 53: ...ethod pane click the Mass Spec icon 5 On the MS tab select a scan type 6 Type values in the fields as required Refer to Parameters on page 56 7 On the Advanced MS tab type values in the fields as required Refer to Parameters on page 56 8 Click a device icon and then select the parameters for the device To configure the syringe pump refer to Configure the Syringe Pump on page 53 9 Add any additiona...

Page 54: ...he m z ratio Perform MS MS or MS MS MS scan types to obtain more information about the ions MS MS MS MS scans are used to help identify or confirm a molecular species In MS MS scans a precursor ion can be fragmented in one of two locations For triple quadrupole systems fragmentation occurs in the collision cell For LIT systems fragmentation can occur in the collision cell or the linear ion trap If...

Page 55: ...ans use the Q3 quadrupole as a linear ion trap Ions are trapped and stored in the trap before being scanned out giving increased sensitivity In addition MS MS MS analysis can be performed in the linear ion trap providing more information about the sample Enhanced MS EMS Ions are scanned in the Q1 quadrupole to the linear ion trap where they are collected These ions are scanned out of the Q3 quadru...

Page 56: ...parameters these parameters can change depending on the ion source used Compound parameters Resolution parameters Detector parameters For more information about instrument parameter values and ranges refer to Appendix A Parameters for 4500 Series Instruments Table 8 1 Spectral Data Acquisition Mode Description Profile The preset value is 0 1 Da Profile data is the data generated by the mass spectr...

Page 57: ...ent applied to the corona discharge needle in the APCI probe used in the Turbo V ion source The discharge ionizes solvent molecules which in turn ionize the sample molecules All 1 ihe Interface Heater Source and gas The ihe parameter turns the interface heater on and off Heating the interface helps maximize the ion signal and prevents contamination of the ion optics The interface heater should alw...

Page 58: ...ace is located between the curtain plate and the orifice It assists in solvent evaporation and prevents solvent droplets from entering and contaminating the ion optics The gas flow should be maintained as high as possible without losing sensitivity All 1 GS1 Gas 1 Source and gas The GS1 parameter controls the nebulizer gas The nebulizer gas helps generate small droplets of sample flow and affects ...

Page 59: ...select or clear the feature based on the experiment The recommended fixed fill time to use with Q0 trapping is 20 ms or greater EMS EMC EPI ER and MS MS MS 3 CAD Gas Source and gas The CAD parameter controls the pressure of collision gas in the collision cell during Q3 MS MS type and LIT scans For Q3 scans the collision gas helps to focus the ions as they pass through the collision cell The preset...

Page 60: ... CES is used When a collision energy spread value is entered CES is automatically turned on Use the preset value and optimize for the compound EPI and MS MS MS 4 CXP Collision Cell Exit Potential Compound The CXP parameter is only used in Q3 and MS MS type scans where it transmits the ions into Q3 Use the preset value and optimize for the compound Q3 MRM MS2 Prec and NL 4 TDF CE Time Delayed Fragm...

Page 61: ... second precursor ion Use the preset value MS MS MS 7 Fixed LIT Fill Time Compound The Fixed LIT Fill Time parameter controls the amount of time that the LIT fills with ions Use the preset value EMS EPI MRM and MS MS MS 7 DFT Dynamic Fill Time Compound DFT dynamically calculates the length of time that ions are collected in the LIT based on the incoming ion signal When DFT is turned on the signal ...

Page 62: ...in the Acquisition Method editor Period Right click to add an experiment add an IDA Criteria Level or delete the period Autosampler Opens the Autosampler Properties tab Syringe Pump Opens the Syringe Pump Properties tab Column Oven Opens the Column Oven Properties tab Valve Opens the Valve Properties tab DAD Opens the DAD Method Editor Refer to Show DAD Data on page 86 ADC Opens the ADC Properties...

Page 63: ...re turned off The user can change the length of time the queue runs after the last acquisition has finished before the Analyst software puts the mass spectrometer into the standby mode For more information about the other fields in the Queue Options dialog refer to the Help 1 In the navigation bar click Configure 2 Click Tools Settings Queue Options 3 In the Max Num Waiting Samples field set the m...

Page 64: ...rometer are kept free of contaminants 6 Select Fail Whole Batch in Case of Missing Vial to fail the entire batch when a missing vial is encountered If this option is not selected only the current sample will fail and the queue will continue to the next sample Add Sets and Samples to a Batch A set can consist of a single sample or multiple samples 1 In the navigation bar under Acquire double click ...

Page 65: ...n section select a method from the list Depending on how the system is set up specific information for the autosampler must be entered Even if the injection volume is set in the method the injection volume can be changed for one or more samples by changing the value in the injection volume column 15 To change the injection volumes from the volumes listed in the method in the Inj Volume µL column t...

Page 66: ...he message 3 Click Submit 4 Save the file Change Sample Order The order of the samples can be edited before they are submitted to the Queue On the Submit tab double click any of the numbers on the far left of the table a very faint square box is visible and then drag them to the new location Acquire Data The system must not be in Tune mode when sample acquisition is started Also if the system has ...

Page 67: ...k Code column select the rack type In the Rack Position column select the position of the rack in the autosampler In the Plate Code column select the plate type In the Plate Position column select the position of the plate on the rack In the Vial Position column type the position of the vial in the plate or tray 3 Save the file Select Vial Positions using the Locations Tab Optional 1 In the Batch ...

Page 68: ...late or tray are shown 6 To select whether samples are marked by row or column click Row Column Selection If the button shows a red horizontal line the Batch Editor marks the samples by row If the button shows a red vertical line the Batch Editor marks the samples by column 7 Click the sample wells or vials in the order to be analyzed Click a selected well or vial again to clear it 8 Save the file...

Page 69: ...ple Batch and Acquisition Method Editor Tips Table 9 1 Tips To do this do this To change all the values in a column simultaneously click a column heading and then right click From the menu use the Auto Increment and Fill Down commands to change the values in the column This also works for multiple cells in the same column To change an existing acquisition method from the list select the method and...

Page 70: ...lick menu Menu Function Open Opens a batch file Import From Imports a file Save As Batch Saves the batch with a different name Save As a Template Saves the batch as a template Used with the Express View feature Hide Show Column Hides or shows a column Save Column Settings Saves the batch column settings Add Custom Column Adds a custom column Delete Custom Column Deletes a custom column Fill Down F...

Page 71: ...is not accepting any sample submissions Stand By In the Stand By state the hardware profile has been activated but all devices are idle Pumps are not running and gases are turned off Warming Up In the Warming Up state the mass spectrometer and devices are equilibrating columns are being conditioned the autosampler needle is being washed and column ovens are reaching temperature The period of equil...

Page 72: ...loaded to each device and device equilibration is occurring This state occurs before the acquisition of each sample in a batch Acquiring In the Acquiring state the method is run and data acquisition occurs Paused In the Paused state the system has been paused during acquisition Table 9 3 Instrument and Device Status showing the instrument icon Status Icon Background Color Description Idle Green or...

Page 73: ...d an error that should be investigated Note For each status the background color can also be red This situation means that the device encountered an error while in that status Figure 9 8 Queue Manager right click menu Menu Function Sample Details Opens the Sample Details dialog Reacquire Acquires a sample again Insert Pause Inserts a pause in seconds between two samples Delete Deletes either the b...

Page 74: ...the sample in the queue Abort Sample Aborts a sample acquisition in the middle of the processing of that sample Stop Queue Stops the queue before it has completed processing all the samples Pause Sample Now Inserts a pause in the queue Insert Pause before Selected Sample Inserts a pause before a specific sample Continue Sample Continues acquiring the sample Next Period Starts a new period Extend P...

Page 75: ... 0264 A 75 of 138 Standby Puts the instrument in standby mode Ready Puts the instrument in ready mode Reserve Instrument for Tuning Reserves the instrument for tuning and calibrating IDA Method Wizard Starts the IDA Method Wizard Table 9 4 Acquire Mode Icons Continued Icon Name Function ...

Page 76: ...Operating Instructions Batches 4500 Series of Instruments System User Guide 76 of 138 RUO IDV 05 0264 A ...

Page 77: ... In the navigation bar under Explore double click Open Data File The Select Sample dialog opens The data acquired from the sample is shown If data is still being acquired the mass spectrum DAD UV trace and TIC continue to update automatically Navigate Between Samples in a Data File Tip To see an example data file make sure that the Example project is selected Open the Triple Quad folder and then o...

Page 78: ...ple acquisition Table 10 1 shows the software functionality available when the user views the file information Click Explore Show Show File Information The File Information pane opens below the graph Note If data is acquired from more than one sample into the same wiff file the file information pane will not refresh automatically as the user scrolls through the samples Close the file information p...

Page 79: ...xplore Show Show List Data The data is shown in a pane below the graph Prerequisite Procedure Open Data Files on page 77 Figure 10 1 Peak List Tab Table 10 2 RIght Click Menu for the Spectral Peak List Tab Menu Function Column Options Opens the Select Columns for Peak List dialog Save As Text Saves the data as text file Delete Pane Deletes the pane ...

Page 80: ... The Select ADC Channel dialog opens 2 In the Channel list select a channel 3 Click OK The ADC data opens in a new pane below the active pane Table 10 3 Right Click Menu for the Chromatographic Peak List Tab Menu Function Analyst Classic Parameters Opens the Analyst Classic dialog IntelliQuan Parameters Opens the Intelliquan dialog Save As Text Saves the data as text file Delete Pane Deletes the p...

Page 81: ...e 10 8 If the MCA check box is selected during acquisition of the data file then the data file opens to the mass spectrum If the MCA check box is not selected then the data file opens with the TIC XIC Extracted Ion Chromatogram An ion chromatogram created by taking intensity values at a single discrete mass value or a mass range from a series of mass spectral scans It indicates the behavior of a g...

Page 82: ...generate an XIC depending on whether chromatographic or spectral data is used Table 10 5 contains a summary of methods that can be used with chromatograms and spectra Prerequisite Procedure Open Data Files on page 77 Open a data file containing spectra Tip To see an example data file make sure that the Example project is selected Open the LIT folder and then open the Reserpine wiff file Tip Right ...

Page 83: ... the top of the pane contains the mass range and the maximum intensity in counts per second Generate an XIC Using Base Peak Masses 1 In a BPC select the peak from which to extract ions The selection is highlighted in blue Base peak masses Yes No Can be used only with BPCs Base Peak Chromatograms Use the Use Base Peak Masses command to extract ions results in an XIC with a different colored trace f...

Page 84: ... Type the values for each XIC to be created If a stop value is not typed then the range is defined by the start value In the Start field type the start value lower value for the mass range In the Stop field type the stop value higher value for the mass range 4 Click OK An XIC of the selection opens below the chromatogram pane The experiment information at the top of the pane includes the masses an...

Page 85: ...ass value 4 In the Minimum Intensity field type the intensity below which peaks are ignored by the algorithm 5 In the Minimum Mass field type the mass that determines the beginning of the scan range 6 In the Maximum Mass field type the mass that determines the end of the scan range 7 To set the start and end times select the Use Limited Range check box and do the following In the Start Time field ...

Page 86: ...ram or spectrum form 1 In the TWC pane click a point to select a single point in time or highlight an area of the spectrum to select a range of time 2 Click Explore Show Show DAD Spectrum The DAD spectrum opens in a pane below the TWC The y axis shows absorbance and the x axis shows wavelength Prerequisite Procedure Open Data Files on page 77 Open a data file that contains a DAD spectrum Figure 10...

Page 87: ...hold value does not change the data The software does not label any peaks in the region that lies below the threshold Do one of the following To raise the threshold drag the blue triangle up the y axis To lower the threshold drag the blue triangle down Click Explore Set Threshold In the Threshold Options dialog that opens type the threshold value Click Explore Threshold The graph updates to show t...

Page 88: ...ser Text Adds a text box at the position of the mouse cursor Set Subtract Range Sets the subtract range in the pane Clear Subtract Range Clears the subtract range in the pane Subtract Range Locked Locks or unlocks the subtract ranges If the subtract ranges are not locked then each subtract range can be moved independently The subtract ranges are preset to locked Delete Pane Deletes the selected pa...

Page 89: ...e A window cannot be sized to the point where any of the panes would become smaller than its minimum size Two or more windows or panes containing similar data can be linked for example spectra with similar mass ranges As one pane or window is zoomed in the other pane zooms in simultaneously For example the user can link an XIC to the BPC from which the XIC was extracted Zooming in the BPC also zoo...

Page 90: ...pectively If the pane is at the left or right of the target pane the pane moves to the left or right of that pane respectively If the pane is at any other position the pane moves to the target row The drop shadow of the pane as the pane is moved around indicates its new position Link panes 1 With the two graphs open click one to make that pane active 2 Click Explore Link and then click the other p...

Page 91: ... expand the area of interest 2 Release the mouse button to draw the graph to the new scale Tile panes Select the graph Click Window Tile all Panes Note Take care when zooming in on the baseline Zoom in too low and the zoom in box closes Tip To return the graph to the original scale double click on either axis To restore the entire graph to original scale click Explore Home Graph Table 10 9 Explore...

Page 92: ...peak Signals below this minimum width are regarded as noise Show ADC Shows ADC data Show File Info Shows the experimental conditions used to collect the data Add arrows Adds arrows to the x axis of the active graph Remove all arrows Removes arrows from the x axis of the active graph Offset Graph Compensates for slight differences in the time during which the ADC data and the mass spectrometer data...

Page 93: ...f data processing operations performed on a particular file such as smoothing subtraction calibration and noise filtering Open Compound Database Opens the compound database Set Threshold Adjusts the threshold Show Contour Plot Shows selected data as either a spectrum graph or an XIC Additionally for data acquired by a DAD a contour plot can show selected data as either a DAD spectrum or an XWC Sho...

Page 94: ...Operating Instructions Analyze and Process Data 4500 Series of Instruments System User Guide 94 of 138 RUO IDV 05 0264 A ...

Page 95: ...culate unknown concentrations A previously saved quantitation method can be selected from the Quantitation menu in the batch For information about creating a batch refer to Add Sets and Samples to a Batch on page 64 The user can create a quantitation method before data acquisition and then apply the method to the quantitative data automatically after the batch is complete Alternatively a quantitat...

Page 96: ...rpine 609 4 195 0 minoxidil 210 2 164 2 tolbutamide 271 3 91 1 and rescinnamine 635 4 221 2 which is the internal standard Batch 1 contains no errors in terms of sample preparation whereas Batch 2 contains a QC sample where the internal standard was added twice sample QC2 Create a Method using the Quantitation Method Editor 1 In the navigation bar under Quantitate double click Build Quantitation M...

Page 97: ...tion Wizard It is recommended that the user validate any queries that are used to analyze data in a Results Table 1 In the navigation bar under Quantitate double click Quantitation Wizard The Create Quantitation Set Select Samples page opens 2 In the Available Data Files list double click the Triple Quad folder 3 Select Mix_Batch_2 wiff 4 Click Add All Files 5 Click Next The Create Quantitation Se...

Page 98: ...validate any queries that are used to analyze data in a Results Table 1 In the navigation bar under Quantitate double click Quantitation Wizard 2 In the Create Quantitation Set Select Samples page select samples 3 Click Next 4 In the Select Settings Query page in the Default Query section select Create New Standard Query 5 Type a query name Note To create a query at the same time refer to Create a...

Page 99: ...riation for each QC for example 5 is 5 in the same row as the corresponding concentration If the concentrations were not specified during acquisition they are not shown here In that case type them in the Concentration column 8 In the Maximum Allowed Accuracy Variation for Standards table in the Max Variation column type the maximum allowable percent of variation for each Figure 11 1 Create Quantit...

Page 100: ... were not specified during acquisition they are not shown here In that case type them in the Concentration column 9 Click Next 10 Select or create a method 11 Click Finish The query is applied as a standard query The query results are shown as a Pass or Fail entry in the Standard Query Status column of the Results Table Figure 11 3 Create Quantitation Set Select Method Page Tip To return to the fu...

Page 101: ...cific analyte Analyte Group Creates an analyte group Sample Type Shows samples of a specific type or all samples Add Formula Column Adds a formula column It is recommended that the user validate the results if a formula column is used Table Settings Edits or selects a table setting Query Creates or selects a query Sort Creates a sort or sorts by index Metric Plot Creates a metric plot Delete Pane ...

Page 102: ... peak in its entirety or may want to examine the baseline to find out how well the software found the start and end points of the peak Use the automatic zooming feature to do either To help the software find a peak define the exact start and end points of the peak and background manually These changes will apply only to that individual peak unless the global method is updated 1 Right click in the ...

Page 103: ... 11 6 9 Go to the second injection of standard 3 In this example the peak can be integrated closer to the baseline by selecting the Specify Parameters option Figure 11 5 Peak Review Options Dialog Item Definition 1 Number of rows 2 Number of columns 3 Zoom Y axis to 100 of largest peak to show the entire peak Tip To move to a specific peak in the Peak Review pane select the corresponding row in th...

Page 104: ... the peak integration then adjust the Noise Percent parameter until the optimal value is found 15 To update the algorithm for all peaks right click in the pane and then click Update Method Figure 11 6 Peak Review Pane Item Description 1 Arrows Click to move through the peaks 2 Show or Hide Parameters Click to show the integration parameters 3 Integration parameters Click to change the parameters N...

Page 105: ...have not been found after the algorithm parameters have been adjusted and updated 1 In the Peak Review pane click Manual Integration Mode Figure 11 7 Update Method Note Peaks that are manually integrated or where the algorithm was changed for only that peak are identified as such in the Record Modified column of the Results Table as are peaks that have algorithm parameter changes for a sample that...

Page 106: ...ftware shades the area bounded by the base and sides of the peak Peak parameters are gray as they are no longer applicable because the peak was drawn manually 4 Do one of the following To make this change permanent click Accept To discard the changes clear the Manual Integration check box Item Description 1 Manual Integration mode Figure 11 9 Peak Review Pane Zooming in on a Peak Item Description ...

Page 107: ...ed concentrations can be compared to the actual value The calibration curve is generated by plotting the concentration of the standard versus its area or height If an internal standard is used the ratio of the standard concentration internal standard Figure 11 10 Peak Review Right Click Menu Menu Function Options Opens the Peak Review Options dialog Sample Annotation Opens the Sample Annotation di...

Page 108: ...bration curve to see the curve used for regression The Calculated Concentration field in the Results Table reflects any changes resulting from the fit of the curve to the points of the standard 1 With a Results Table open click Tools Calibration Pane The Calibration Curve pane containing the calibration curve opens 2 If there is more than one analyte then use the following steps to view the calibr...

Page 109: ...d then click Overlay 3 Select the tables to overlay with the current curve 4 Click OK The software plots the curves for all selected tables on the same graph Calibration Curve Right Click Menu Right click in the Calibration window or pane table to access the following options Note To examine the curve for one table more closely right click the curve and click Active Plot Select the curve to be plo...

Page 110: ... and Accuracy columns The CV shows the coefficient of variance between the measurements of a single parameter for example the area Accuracy shows how close the plotted point is to the interpolated value Menu Function Exclude Include Right click the point and then click Exclude to exclude the point from the curve Right click the point and then click Include to include the dropped point Exclude All ...

Page 111: ... By Batch To arrange the results in order of concentration in the Conc as Rows list select Group By Concentration To arrange the results in order of concentration but without a row showing the statistics for each group or batch in the Conc as Rows list select Group By Concentration no All The software sorts the results At the end of each batch or group one or two additional rows are shown All stat...

Page 112: ...lumn A locked column cannot be moved Metric Plot by Selection Creates a metric plot from the selected column Show all Samples Shows all the samples in the Results Table Delete Formula Column Deletes formula columns Table 11 3 Icon Quick Reference Quantitate Mode Icon Name Function Add Remove Samples Adds or removes samples from the Results Table Export as Text Saves the Results Table as a text fil...

Page 113: ...peak in the pane or window Show Last Peak Shows the last peak in the pane or window Show Audit Trail Shows the audit trail for the Results Table Clear Audit Trail Clears the audit trail for the Results Table Statistics Opens the Statistics window Report Generator Opens the Reporter software Table 11 3 Icon Quick Reference Quantitate Mode Continued Icon Name Function ...

Page 114: ...Operating Instructions Analyze and Process Quantitative Data 4500 Series of Instruments System User Guide 114 of 138 RUO IDV 05 0264 A ...

Page 115: ...port Template Editor Contains a blank starting template that can be used in the Analyst software Reporter editing environment to design report templates to meet most report requirement Automates report generation through the use of the Autoquan Reporter batch script Automatically prints exports to Adobe Portable Document Format pdf and delivers results by e mail This functionality requires the Sav...

Page 116: ...eplaced with text from a matching tag in the dictionary file for the selected language These dictionary files are contained in the folder C Program Files AB SCIEX AnalystReporter Resources Languages 2 Settings Select Library Browse to an spectral library This library will be used for matching and scoring MS MS from Results Tables that contain data from information dependent acquisition IDA trigger...

Page 117: ... report template are enabled Word Microsoft Word document docx is produced This document can be viewed by Microsoft Word 2007 and above PDF The PDF option creates a report directly in PDF format HTML Microsoft Word is used to generate an HTML file Associated image files are stored in a folder with the same name as the HTML file Excel A plain text file csv is produced Report templates that contain ...

Page 118: ...Select the Print Automatically check box if you want your reports to print automatically to a pre selected printer The Default Printer set in Windows is used unless you select a different printer The Reporter tool retains the selected printer between operations If the printer is set to a pdf printer driver then you can use the Analyst Reporter to generate pdf file versions of the created reports a...

Page 119: ...tenance Tasks Component Frequency Task For more information Curtain plate Daily Clean Refer to Clean the Curtain Plate on page 124 Orifice plate front Daily Clean Refer to Clean the Front of the Orifice Plate on page 124 Orifice plate front and rear As needed Clean Contact the local QMP or AB SCIEX Field Service Employee FSE QJet ion guide As needed Clean Contact the local QMP or FSE Q0 and IQ1 le...

Page 120: ... Clean the Surfaces Clean the external surfaces of the mass spectrometer after a spill or when they become dirty 1 Wipe the external surfaces with a soft cloth dampened with warm soapy water 2 Wipe the external surfaces with a soft cloth moistened with water to remove any soap residue Tip Clean the Q0 region regularly to minimize the impact of charging a significant loss of sensitivity of the ions...

Page 121: ...spectrometer Note Follow all applicable local regulations For health and safety guidelines refer to Chemical Precautions on page 11 Note U S customers can call 877 740 2129 for ordering information and inquiries International customers can visit www absciex com Required Materials Powder free gloves nitrile recommended Safety glasses Laboratory coat Fresh high quality water at least 18 Mohm de ioni...

Page 122: ...contact the surface once and then discard it Larger parts of the vacuum interface such as the curtain plate may require several cleanings using multiple wipes To avoid contaminating the solution pour the solution on the wipe or swab WARNING Toxic Chemical Hazard Follow all safety guidelines and applicable local regulations when handling storing and disposing of chemicals For health and safety guid...

Page 123: ...he hardware profile 2 Wait at least 30 minutes for the ion source curtain plate and orifice plate to cool 3 Remove the ion source Be sure to place the ion source in a safe location Caution Potential System Damage Be careful not to not drop anything into the source drain when the ion source is removed Note Mass spectrometers with a NanoSpray ion source may require a full cleaning for best results C...

Page 124: ...te is dry 6 Inspect the curtain plate for solvent stains or lint removing any residue with a clean slightly damp lint free wipe Clean the Front of the Orifice Plate 1 When cleaning a NanoSpray orifice plate remove the interface heater and clean it i Wipe the heater with a lint free wipe dampened with water ii Wipe the heater with a lint free wipe dampened with cleaning solution Figure 13 3 Interfa...

Page 125: ... the ion source Operator Guide 3 Activate the hardware profile Empty the Source Exhaust Drain Bottle Empty the source exhaust drain bottle before it becomes full 1 Remove the ion source Refer to the ion source Operator Guide 2 Loosen the clamps connecting the hoses to the cap of the source exhaust drain bottle 3 Remove the drain bottle from the cap Note Persistent spotting or filming is an indicat...

Page 126: ...ain bottle is located at the side of the mass spectrometer when installed 3 Connection to vent Caution Asphyxiation Hazard Take care to vent exhaust gases properly The use of mass spectrometers without adequate ventilation to outside air may constitute a health hazard In addition certain procedures required during the operation of the mass spectrometer may cause gases to be discharged into the exh...

Page 127: ...formation To disconnect power from the mass spectrometer remove the mains supply connector from the AC mains supply WARNING Environmental Hazard Do not dispose of waste of electrical and electronic equipment as unsorted municipal waste It must be collected separately Contact AB SCIEX for more information concerning the decommissioning of equipment Note The system must be transported and stored bet...

Page 128: ...Service and Maintenance Information 4500 Series of Instruments System User Guide 128 of 138 RUO IDV 05 0264 A ...

Page 129: ...sitivity loss Instrument or ion source requires tuning and optimizing For more information refer to Operating Instructions Tune and Calibrate on page 49 Ion source Operator Guide Analyst software Help system Dirty curtain plate Clean the Curtain Plate on page 124 Dirty orifice plate Clean the Front of the Orifice Plate on page 124 Dirty QJet ion guide Q0 or IQ0 Contact an FSE or the local Qualifie...

Page 130: ...Troubleshooting 4500 Series of Instruments System User Guide 130 of 138 RUO IDV 05 0264 A ...

Page 131: ... High CAD b 0 Fixed 5 Fixed 9 0 to 12 0 Fixed 5 Fixed 9 0 to 12 IS 1 2 5500 0 to 5500 5500 0 to 5500 5500 0 to 5500 4500 4500 to 0 4500 4500 to 0 4500 4500 to 0 IS 5 Ion Transfer Voltage 1500 0 to 2500 1500 0 to 2500 1500 0 to 2500 1500 2500 to 0 1500 2500 to 0 1500 2500 to 0 IS 6 1000 0 to 4000 1000 0 to 4000 1000 0 to 4000 1000 4000 to 0 1000 4000 to 0 1000 4000 to 0 NC 3 4 3 0 to 5 3 0 to 5 3 0...

Page 132: ...150 0 to 250 150 0 to 250 150 0 to 250 150 0 to 250 sdp 1 1 or 2 1 1 or 2 1 1 or 2 1 1 or 2 1 1 or 2 1 1 or 2 IQ1 IQ1 Q0 offset Q0 0 5 Q0 0 5 Q0 0 5 Q0 0 5 Q0 0 5 Q0 0 5 ST ST Q0 offset Q0 8 12 to 5 Q0 8 12 to 5 Q0 8 12 to 5 Q0 8 12 to 5 Q0 8 12 to 5 Q0 8 12 to 5 IE1 a IE1 Q0 RO1 1 6 0 to 3 n a 2 0 to 3 1 3 to 0 n a 1 5 to 0 IE1 b IE1 Q0 RO1 0 9 0 to 3 n a 0 9 0 to 3 1 3 to 0 n a 1 5 to 0 IQ2 a IQ...

Page 133: ... ST3 n a 9 0 to 55 27 0 to 55 n a 17 55 to 0 12 55 to 0 RO3 50 Fixed n a n a 50 Fixed n a n a IE3 a n a 1 5 0 to 5 1 8 0 to 5 n a 1 100 5 to 0 1 5 to 0 IE3 b n a 2 0 to 5 1 5 0 to 5 n a 2 500 5 to 0 1 2 5 to 0 DF a 100 Fixed 100 Fixed 100 Fixed 100 Fixed 100 Fixed 100 Fixed DF b 250 Fixed 250 Fixed 250 Fixed 150 Fixed 150 Fixed 150 Fixed Table A 1 4500 Series Instrument Parameters Continued Access...

Page 134: ...um High IS 1 2 5500 0 to 5500 4500 4500 to 0 IS 5 1500 0 to 2500 1500 2500 to 0 IS 6 1000 0 to 4000 1000 4000 to 0 NC 3 4 3 0 to 5 3 5 to 0 TEM 2 3 4 5 0 0 to 750 0 0 to 750 DP 100 0 to 300 100 300 to 0 EP 10 2 to 15 10 15 to 2 AF2 0 100 0 or 1 0 100 0 or 1 AF3 Mass Speed Dependent 0 to 10 Mass Speed Dependent 0 to 10 EXB Mass Speed Dependent 165 to 0 Mass Speed Dependent 0 to 165 CEM 1800 0 to 33...

Page 135: ...0 0 to 250 150 0 to 250 sdp 1 1 or 2 1 1 or 2 1 IonSpray ion source 2 TurboIonSpray ion source 3 Heated Nebulizer 4 DuoSpray ion source 1 TIS and 2 HN 5 PhotoSpray ion source 6 NanoSpray ion source Table A 2 QTRAP 4500 System Parameters for LIT Scan Types Only Continued Access ID Positive Ion Mode Negative Ion Mode ...

Page 136: ...4500 Series of Instruments System User Guide 136 of 138 RUO IDV 05 0264 A ...

Page 137: ... Q3 LIT Instrument Positive Negative Positive and Negative QTRAP 4500 LC MS MS system 2 10 6 M PPG 1 50 3 10 4 NEG PPG 1 100 Agilent mix Table B 4 Q1 and Q3 PPG Positive Ion Scans Instrument Masses AB SCIEX Triple Quad 4500 system 59 0 175 1 500 3 616 5 906 7 1254 9 1545 1 1952 4 QTRAP 4500 LC MS MS system 59 0 175 1 500 3 616 5 906 7 1254 9 1545 1 1952 4 Table B 5 Q1 and Q3 PPG Negative Ion Scans...

Page 138: ...Calibration Ions and Solutions 4500 Series of Instruments System User Guide 138 of 138 RUO IDV 05 0264 A ...

Reviews: