ProStar325 Service Manual
124
Publication date 8 May 2003
Just below this is the graph menu bar. It allows for;
•
auto scaling axis
•
trace zooming
•
cursor options
•
report generation
•
graph options
•
mathematics functions
7.6.4
Status bar
The status bar will always appear at the bottom of the screen. It
indicates the status of;
•
detector
•
lamps
•
Ethernet connection
Various colors indicate different status levels. These are detailed
in the “Detector Status” description section of this manual.
7.7
Main Display
The “Main” page is used to view spectrum traces collected during
troubleshooting and detector performance verification.
X&Y axis co-ordinates are chosen in the “Method” page.
The trace window can be expanded to any size by dragging out its
edges. Double clicking in the trace window will also toggle the
size of the window, making it possible to view report information
such as method parameters as well as the spectrum trace on the
one page.
When moving the cursor across the spectrum, the X&Y co-
ordinates will be shown in the bottom left corner of the trace
window.
StockCheck.com
Содержание ProStar 325 UV-Vis
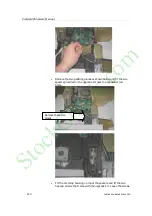
Страница 9: ...ProStar325 Service Manual Publication date 8 May 2003 9 S t o c k C h e c k c o m ...
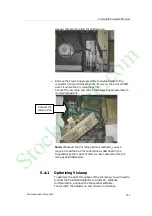
Страница 19: ...ProStar325 Service Manual Publication date 8 May 2003 19 S t o c k C h e c k c o m ...
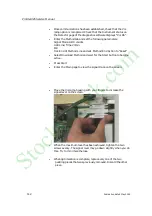
Страница 34: ...ProStar325 Service Manual 34 Publication date 8 May 2003 S t o c k C h e c k c o m ...
Страница 71: ...ProStar325 Service Manual Publication date 8 May 2003 71 S t o c k C h e c k c o m ...
Страница 72: ...ProStar325 Service Manual 72 Publication date 8 May 2003 S t o c k C h e c k c o m ...
Страница 99: ...ProStar325 Service Manual Publication date 8 May 2003 99 Deuteriu m lamp S t o c k C h e c k c o m ...
Страница 118: ...ProStar325 Service Manual 118 Publication date 8 May 2003 S t o c k C h e c k c o m ...
Страница 149: ...ProStar325 Service Manual Publication date 8 May 2003 149 S t o c k C h e c k c o m ...

