Monitoring
216
There are two ways to go to the [operating data] monitoring interface.
Go to the [Monitoring] menu, click on [Monitoring parameters], and the display area on the main page will show
[operating data];
Click [Monitoring] in the [monitoring item selection] bar on the main page, as shown in the figure above, and the display
area of the main page will show [operating data].
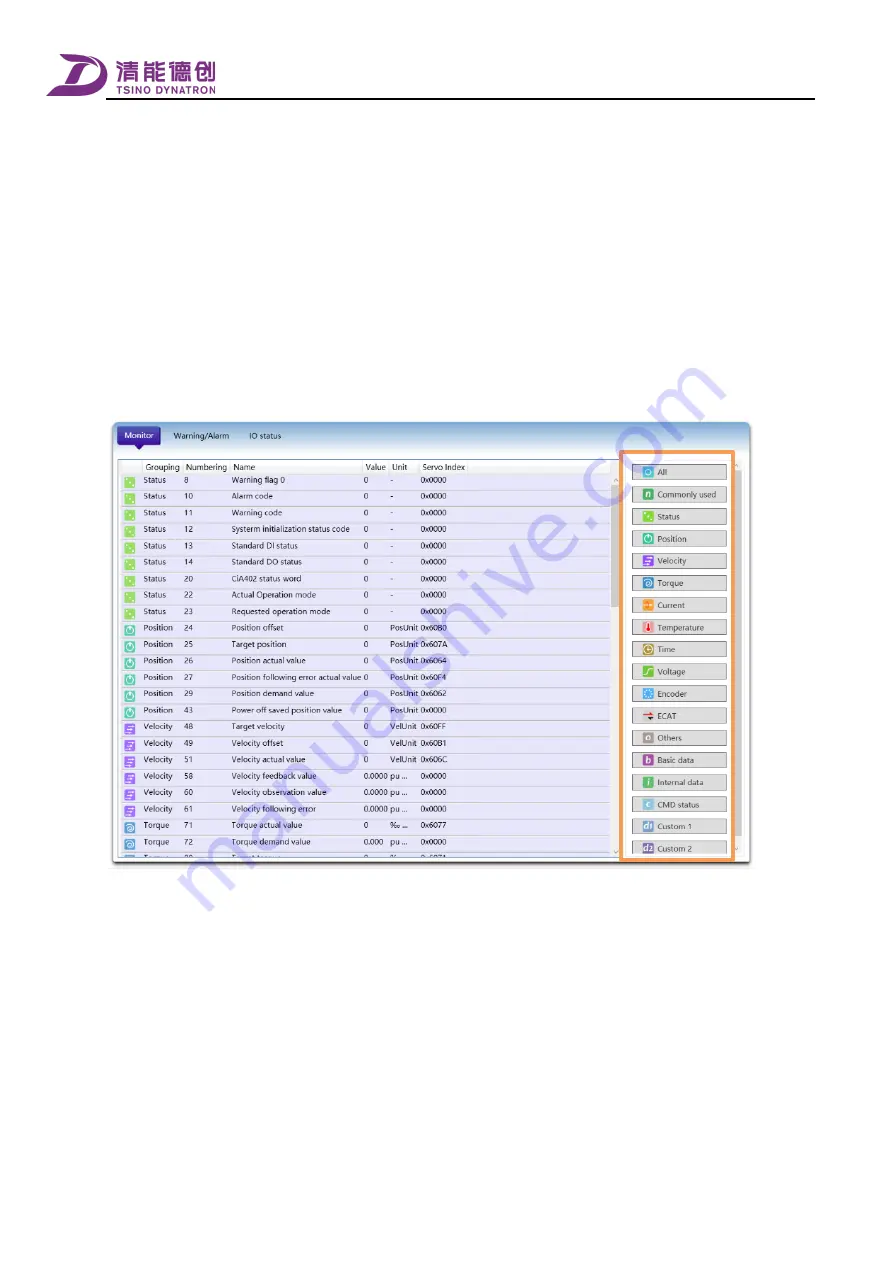
Variable group selection
The group of monitoring variables can be selected in the area shown in the box below. After clicking the corresponding
group option, the data display area will only show the monitoring variables under this group. When "All" is selected, the display
area will show all the monitoring variables in the ascending order of serial number by default.
Configure variables to [data tracing]
Monitoring variables in the display area can be directly configured as the variables in the [data tracing] function.
As shown in the figure below, right-click the corresponding variable in the display area, select [Send to [
Trace tracking
]] in
the pop-up dialog box, and channels of data trace will be displayed in the sub-menu, where:
[Configured channel] is a channel for which trace variable has been configured in the data trace function. If the trace
variable needs to be overridden, click the channel and replace the trace variable with the current monitoring variable.
A [configurable channel] is currently available. and its trace variable has not been configured. The font is in black. It is
usually the first channel following the [configured channel]. Its trace variable can be set as the current monitoring variable
by directly clicking on it.
Содержание CoolDrive Series
Страница 1: ...CoolDrive Series Smart 7 Servo Drive User Manual Model CDS7S EtherCAT interface Document Version R1 ...
Страница 29: ...Preface 17 T2 model ...
Страница 30: ...Preface 18 T3 model ...
Страница 31: ...Preface 19 T4 model ...
Страница 230: ...Monitoring 218 ...


