


Texmate, Inc. Tel. (760) 598-9899
•
www.texmate.com
Page 26
6/23/04 DI-50B51 320 Series (NZ306)
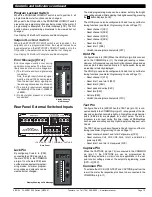
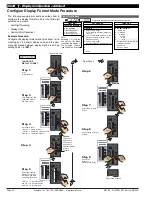
For example, if the meter's full scale range is 20,000 counts,
the midpoint is 10,000 counts. If a signal of 10,000 counts is
applied, only one segment at the 10,000 count mark lights up.
If a signal of 17,000 counts is applied, the segments between
the center segment (10,000 counts) and the 17,000 count
mark light up.
If a signal of 5000 counts is applied, the segments between the
center segment (10,000 counts) and the 5000 count mark light
up.
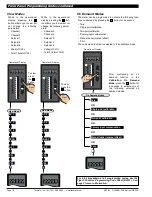
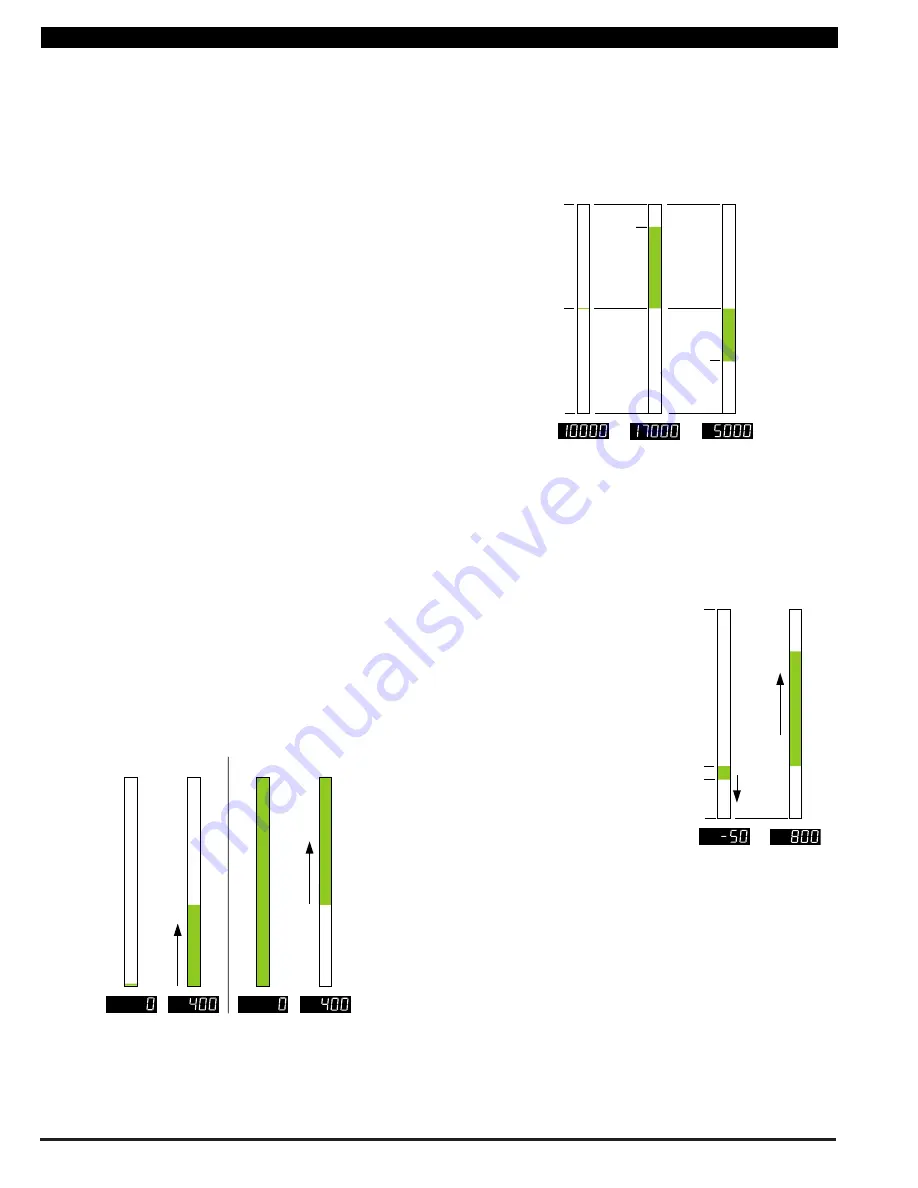
An added feature of this bargraph is that it can also be non-
symmetrical. This means that the bar nominal setting does not
need to be set at the mid-point between bar low and bar high.
For example, if the bargraph is configured to display
–
200 to
800
°
C, bar low is set to
–
200 counts and bar high is set to 800
counts. Bar nominal is set to 0 counts. If a signal of
–
50
°
C is
applied, the bar lights from 0 down to
–
50. If a signal of 600
°
C
is applied, the bar lights from 0 up to 600.
20,000
17,000
0
10,000
5000
Typical Center Zero Bargraph
800
–
200
0
Bar Nominal
–
50
0
600
Non-symmetrical Zero
Bargraph
Bargraph Scaling using Linearization Table 1
When set in this mode, the register selected to be displayed on
the bargraph display (Code 1 set to [XX1]) is first processed
through a 32-point flexible linearization table (Table 1) before
being displayed.
This can be used, for example, if channel 1 is the required dig-
ital display while the bargraph display is the square root of
channel 1.
See Linearization Supplement (NZ207) for full details to set
up linearization Table 1.
Selecting
3
in the 1st digit and
1
in the 3rd digit selects
Bargraph scaling via Linearization Table 1.
Example Procedure
. To scale the bargraph using Linearization
Table 1, follow the
Scale Bargraph using Linear Scaling
Procedure
on Page 33. Ensure the secondary (bargraph) dis-
play has been set up in Code 1 and Linearization Table 1 has
been formatted and selected for the required application.
Example Procedure
. The
example procedure on
Page 33 shows how to
scale the bargraph using
linear scaling.
Text Character – 2nd Digit [X7X]
Selecting
7
in the 2nd digit allows you to select one of 54 char-
acters and apply it to the last digit when the meter is in the oper-
ational display.
For example, if the meter was measuring a temperature, the
display could be configured to display the reading with a C or
an F in the last digit for
°
C or
°
F.
Example Procedure
. The example procedure on Page 31
shows how to configure the last digit text character as
“
C
”
for
centigrade (
°
C) for the 3rd digit selection.
Note:
After setting any or all the above three modes [X5X], [X6X],
[X7X], the Code 1 display must be set back to [X0X] to
leave Code 1 and carry on programming.
Set Up Bargraph Scaling
This mode is where the span range of the bargraph is scaled.
The span range of the bargraph can be set between
–
19999 to
99999 counts. There are three methods of scaling the bargraph:
•
Linear.
•
Via Linearization Table 1.
•
Logarithmic.
Selecting 3 in the 1st digit enters the Set Up Bargraph Scaling
mode.
Linear Bargraph Scaling
The most common method of scaling the bargraph is through
the Linear Bargraph Scaling sub-menu. In this menu the bar
low, bar high, and bar nominal settings are set.
Bar Low
[bAr_L] is the setting in counts required at the bottom
of the bargraph.
Bar High
[bAr_h] is the setting in counts required at the top of
the bargraph.
Bar Nominal
sets the point on the bargraph at which the bar
begins to light up. This can be any position between and includ-
ing the bar low and bar high settings.
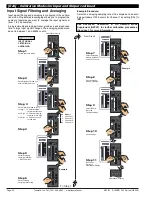
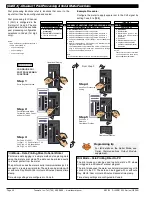
If bar nominal is set to the
bar low
setting, the bargraph
behaves like a typical bargraph making the segments light up
from the
bottom
of the bar and grow towards the top.
If bar nominal is set to the
bar high
setting, this makes all seg-
ments from the displayed signal to the
top
of the bar light up.
As the signal increases, the number of lit segments between
the signal and the bar high setting becomes steadily less. When
the signal reaches the bar high setting no segments are lit.
Bar
High
No Signal
Bar
Low
Signal Applied
Bar
High
No Signal
Bar
Low
Signal Applied
Bar Nominal set to Bar Low
Bar Nominal set to Bar High
Bargraph Nominal Set Low or High
Setting bar nominal to the midpoint between bar low and bar
high makes the bargraph behave like a typical center zero bar-
graph. This means the bargraph lights up at the center of the
bar and moves either up or down the bar depending on the
displayed signal.
I
n
i
ti
al
S
e
t
up P
r
o
c
e
du
r
e
s
[
C
o
d
E
_
1
]
-
D
i
s
p
l
a
y
C
o
nf
i
g
u
r
ati
o
n
c
o
n
ti
nu
e
d


