62
January 2022
BlowerDoor Standard
6.2
Test Graph
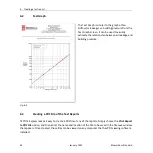
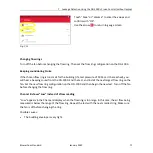
Fig. 6.3
The Test Graph is similar to the graph of fan
airflow (or leakage) vs. building pressure from the
Test Graph screen. It can be used to visually
estimate the relationship between air leakage and
building pressure.
6.3
Creating a PDF File of the Test Reports
TECTITE Express makes it easy to create a PDF file of any of the reports. Simply choose the
Print Report
to PDF File
option, and then enter the name and location of the file to be saved in the file save window
that appears. Once created, these files can be viewed on any computer that has PDF viewing software
installed.

