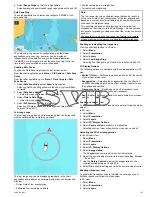
12.8 Measuring distances and bearings
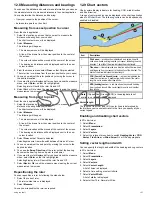
You can use the databar and context menu information you can use
the measure function to measure distances in the chart application.
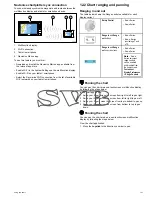
You can determine the distance and bearing:
• from your vessel to the position of the cursor;
• between two points on the chart.
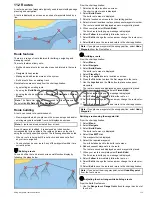
Measuring from vessel position to cursor
From the chart application:
1. Select the location on screen that you want to measure the
distance or bearing from your vessel.
The chart context menu will be displayed.
2. Select
Measure
.
The following will happen:
• The measure menu will be displayed.
• A line will be drawn from the cursor position to the center of
the screen.
• The cursor location will be moved at the center of the screen.
• The bearing and distance will be displayed next to the new
cursor location.
3. From the measure menu select
From
so that Ship is selected.
The ruler line is re-drawn from the cursor position to your vessel.
4. You can now adjust the ruler position by moving the cursor to
the desired location.
5. If you want the ruler displayed after you have closed the measure
menu, select
Ruler:
so that On is highlighted.
Selecting ruler will switch the ruler On and Off.
6. Select Back or Ok to close the measure menu leaving the current
measurement on-screen.
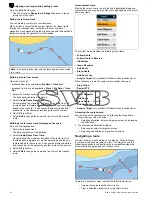
Measuring from point to point
From the chart application:
1. Select the location on screen that you want to measure the
distance or bearing from your vessel.
The chart context menu will be displayed.
2. Select
Measure
.
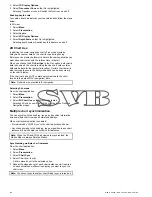
The following will happen:
• The measure menu will be displayed.
• A line will be drawn from the cursor position to the center of
the screen.
• The cursor location will be moved at the center of the screen.
• The bearing and distance will be displayed next to the new
cursor location.
3. Select
From
so that Cursor is selected.
Selecting measure from will switch between Ship and Cursor.
4. You can now adjust the end point by moving the cursor to the
desired location.
5. You can also
Swap Direction
of the ruler so that the bearing
becomes the bearing from end point to start point.
6. If you want the ruler displayed after you have closed the measure
menu, select
Ruler
so that On is highlighted.
Selecting display ruler will switch the ruler On and Off.
7. Select
Back
or
Ok
to exit the measure menu leaving the current
measurement on-screen.
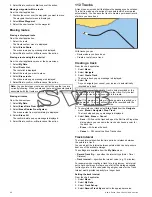
Repositioning the ruler
You can reposition a ruler by following the steps below.
1. Select the current ruler.
The ruler context menu is displayed.
2. Select
Measure
.
You can now reposition the ruler as required.
12.9 Chart vectors
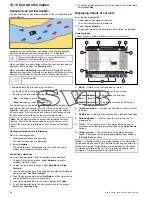
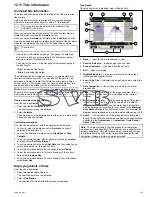
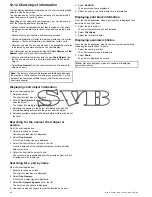
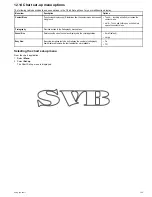
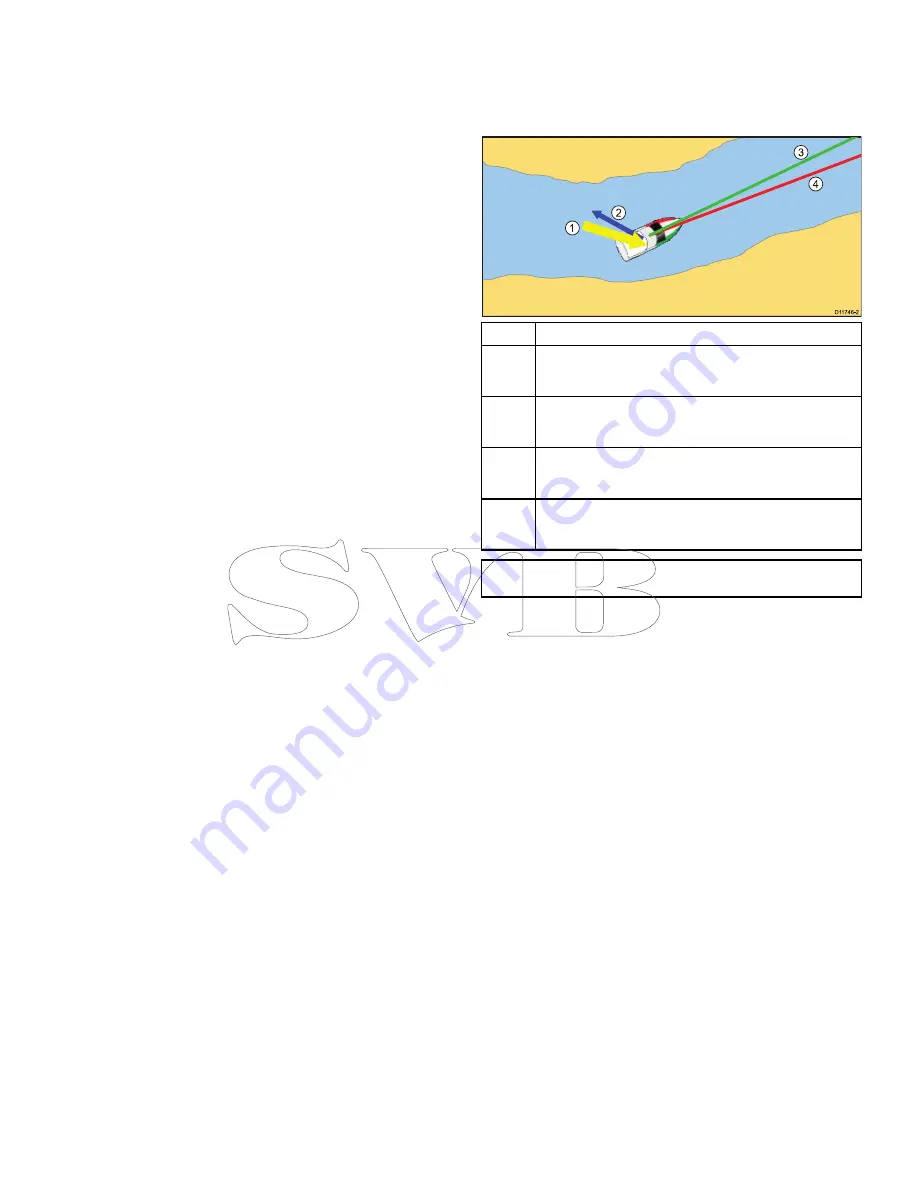
Chart vectors display indicators for heading, COG, wind direction
and tide direction.
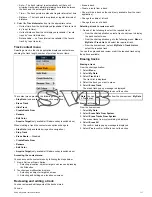
A range of vector graphics can be displayed in the chart application
when in 2D chart view. The following vectors can be independently
enabled or disabled:
D
11746-2
1
2
3
4
Item
Descriptions
1
Wind arrow
— wind direction is displayed as a yellow line with
solid arrow heads pointing towards your vessel, indicating the wind
direction. The width of the arrow indicates the wind strength.
2
Tide arrow
— tide is displayed as a blue line with solid arrow head
pointing away from your vessel, in the direction of the tidal set. The
width of the arrow indicates the tide strength.
3
COG (Course Over Ground) vector
— a green line indicates the
vessel’s actual course. A double arrow head is used if the vector
length is set to a value other than infinite.
4
HDG (heading) vector
— a red line shows the vessel's heading.
An arrow head is used if the vector length is set to a value other
than infinite.
Note:
If Speed Over Ground (SOG) or heading data is not
available, vectors cannot be displayed.
Vector length
The length of the HDG and COG vector lines is determined by
the distance your vessel will travel in the time you specify at your
current speed.
Enabling and disabling chart vectors
In 2D chart view:
1. Select
Menu
.
2. Select
Presentation
.
3. Select
Layers
.
4. Select
Vectors
.
5. Select the relevant menu item to switch
Heading Vector
,
COG
Vector
,
Tide Arrow
, or
Wind Arrow
On or Off as appropriate.
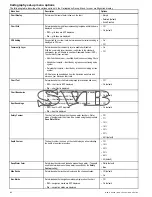
Setting vector length and width
You can specify the length and width of the heading and cog vectors
In 2D chart view:
1. Select
Menu
.
2. Select
Presentation
.
3. Select
Layers
.
4. Select
Vectors
.
5. Select
Vector Length
.
A list of times is displayed .
6. Select a time setting or select Infinite.
7. Select
Vector Width
.
A list of widths is displayed.
8. Select either Thin, Normal or Wide.
Using the chart
127
Содержание A65
Страница 2: ......
Страница 4: ......
Страница 8: ...8 New a Series New c Series New e Series...
Страница 12: ...12 New a Series New c Series New e Series...
Страница 20: ...20 New a Series New c Series New e Series...
Страница 36: ...36 New a Series New c Series New e Series...
Страница 64: ...64 New a Series New c Series New e Series...
Страница 86: ...86 New a Series New c Series New e Series...
Страница 96: ...96 New a Series New c Series New e Series...
Страница 106: ...106 New a Series New c Series New e Series...
Страница 138: ...138 New a Series New c Series New e Series...
Страница 192: ...192 New a Series New c Series New e Series...
Страница 202: ...202 New a Series New c Series New e Series...
Страница 203: ...Chapter 17 Using the fuel manager Chapter contents 17 1 Fuel manager overview on page 204 Using the fuel manager 203...
Страница 206: ...206 New a Series New c Series New e Series...
Страница 218: ...218 New a Series New c Series New e Series...
Страница 228: ...228 New a Series New c Series New e Series...
Страница 232: ...232 New a Series New c Series New e Series...
Страница 242: ...242 New a Series New c Series New e Series...
Страница 248: ...248 New a Series New c Series New e Series...
Страница 286: ...286 New a Series New c Series New e Series...
Страница 289: ...Chapter 29 Technical specification Chapter contents 29 1 Technical specification on page 290 Technical specification 289...
Страница 300: ...300 New a Series New c Series New e Series...
Страница 307: ......
Страница 308: ...www raymarine com...

