


4-18
VIBXPER
T II 05.2012
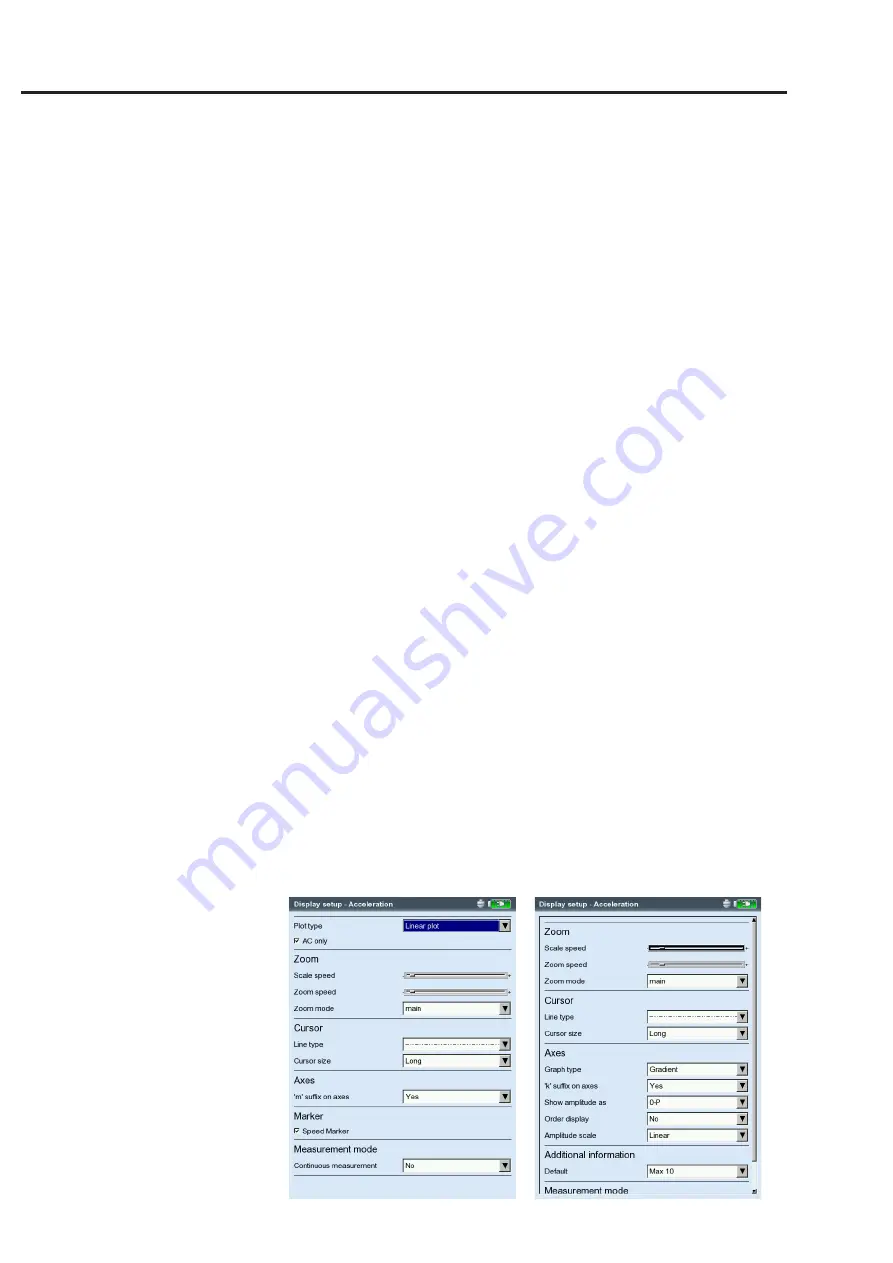
Left:
Display setup for time waveform
Right:
Display setup for spectrum
B1. Display Setup for measurement: Spectrum / Time waveform
Z
oom
:
Step size when zooming the
X and Y-axis
.
Zoom Mode
: The zoom is made around the main cursor or the gap
between the delta and main cursor.
c
ursor
:
Cross (
short
) or line cursor (
long
);
line type
for the line cursor
g
raph
type
:
A spectrum can be displayed in a
curve diagram ('continu-
ous')
or a
bar chart ('poles')
. 'Gradient' colors the area under the
graph. For a sound spectrum select the 'octave' or the 'third octave'
option. A time waveform can be displayed in Cartesian coordinates
(
X-Y diagram
) or on a
circular plot
. When taking measurements
with DC coupling, the DC component in the signal can be hidden
(Option: ‘AC only’).
s
uffix
for
1/1000
or
1000:
Instead of '1/1000' or '1000', the X-axis can
be labeled with the abbreviation 'm' (milli) or 'k' (kilo).
a
mplitude
(
spectrum
)
: Amplitudes in
RMS
or peak values (
0-peak, peak-
peak
). RMS value of entire spectrum: see p. 4-11.
o
rder
display
(
spectrum
):
Scaling of the X-axis in Hz (
No
) or orders
(
Yes
). The shaft RPM must be known (measured or entered).
a
mplitude
scaling
(
spectrum
):
linear or logarithmic (in decibels).
d
efault
display
mode
(
spectrum
):
Information that appears in the lower
pane by default (
Max 10, time waveform, band alarms, frequency
marker, trending parameters, cursor coordinates
).
s
peed
m
arker
(t
ime
signal
):
Display of the trigger signals in the dia-
gram. In the circular plot, the arrow indicates the direction of rota-
tion.
c
ontinuous
measurement
(
live
mode
):
see section X on page 4-17.
B2. Display Setup for Trend: Spectrum (Waterfall diagram)
c
ursor
& a
mplitude
:
s. section B1; in a waterfall diagram, a
grid
can be
superimposed for easier evaluation of the data.
Display setup
Содержание VIBXPERT II
Страница 175: ......


