


112
Segment Program 2 Screens
Section 4-11
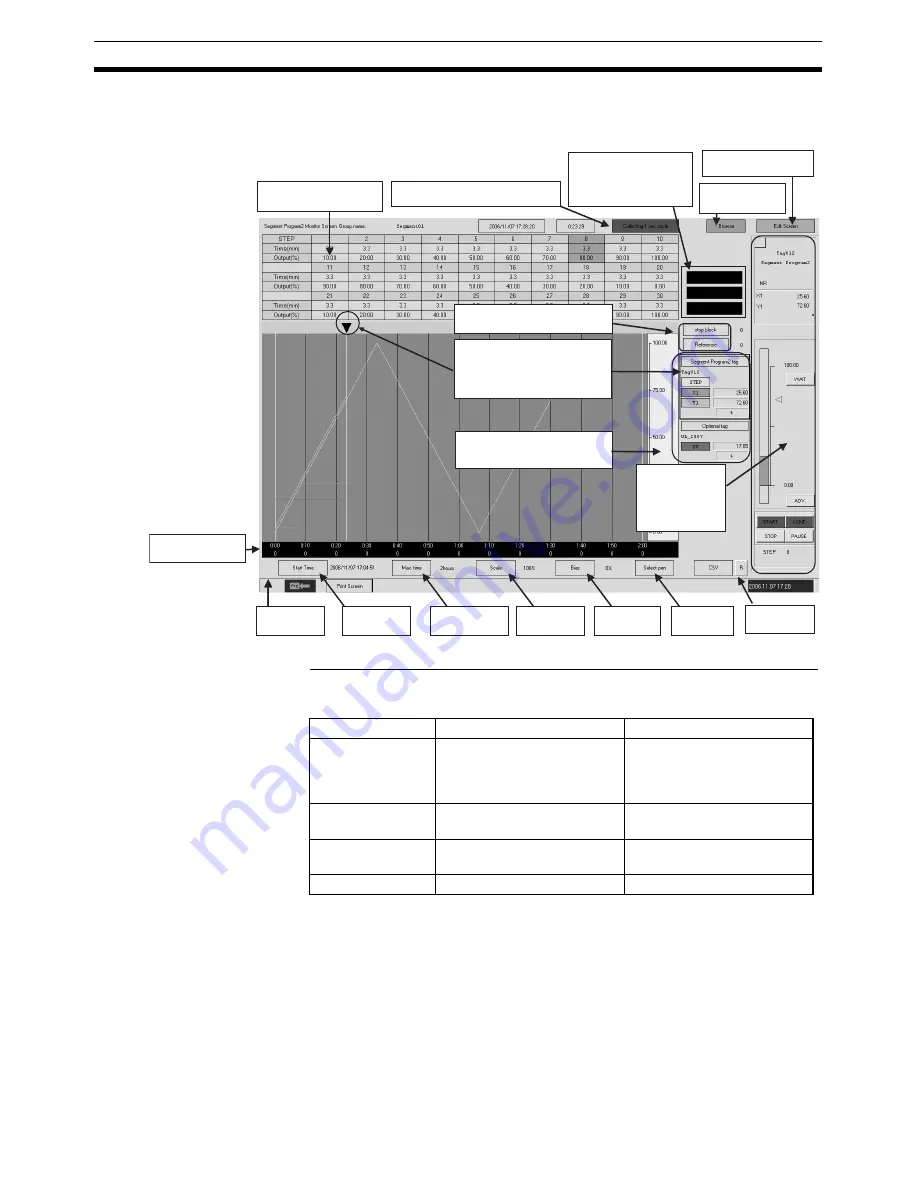
4-11-2 Segment Program 2 Monitor Screen Examples and Operations
Segment Program 2 present values are displayed in a trend graph.
Data That Can Be Monitored on the Segment Program 2 Monitor Screen
The following data can be displayed simultaneously on the Segment Program
2 Monitor Screen.
Note
Step Data Display
When the Segment Program 2 Monitor Screen is displayed first, the step data
is not displayed. (Step data is displayed by starting segment data collection.)
To check in advance the step data executed on the Segment Program 2 Mon-
itor Screen, move to the Segment Program 2 Edit Screen.
With the move to the Segment Program 2 Edit Screen, new Segment Program
2 step data is received from the Loop Controller and the display is updated on
the Segment Program 2 Monitor Screen.
Click to display details for any step.
Steps being executed are displayed in
green.
Shows segment data collection status.
Click to display the Collection Status Monitor Dialog
Box.
The following displays will be shown for
the Segment Program 2 status.
•
WAIT: Waiting
•
GOAL: Segment finished
•
Input error: An input error occurred.
Click to move to the Segment
Program 2 Edit Screen.
Click to browse Segment
Program 2 trend files
collected previously.
Used to change the following parameter settings.
•
Stop block operation command (ITEM 000)
•
Reference input disable (ITEM 020)
Data values (default: present values) at the point
displayed by this mark are displayed in the frame.
The mark can be moved by dragging it with the
cursor.
Press the
F5
Key to return the mark to the present
position.
The graph vertical axis display (upper and lower
limits and division number) can be set for each
selected tag (Segment Program 2 tags or optional
tags).
Horizontal axis display
Top line: Hour and minutes
Bottom line: Day
Time scroll
Shifts one half screen
to the past.
Sets the time from
which data will be
displayed.
Sets the maximum
width for the time axis
displayed on the screen.
Used to zoom the
scale displayed.
Used to add bias to
the display.
Used to select the
pen to be displayed.
Time scroll
Shifts one half screen
to the future.
The faceplate for the
Segment Program 2 block
is displayed.
For details on the faceplate,
refer to
4-7-2 Basic
Displays and Operations
.
Data
Color of line on graph
Details
Step data
Yellow
Step data in the Loop Control-
ler is displayed on the screen
in advance, overlapping other
tag values.
Program output Y1
(ITEM 008)
Light blue
---
Reference input X1
(ITEM 007)
Green
---
Optional tag
Purple
Specify any tag
Содержание CX-Process Monitor Plus 2
Страница 1: ...CX Process Monitor Plus Ver 2 Cat No W428 E1 02 SYSMAC WS02 LCMC1 EV2 OPERATION MANUAL...
Страница 2: ...WS02 LCMC1 EV2 CX Process Monitor Plus Ver 2 Operation Manual Revised January 2007...
Страница 3: ...iv...
Страница 5: ...vi...
Страница 9: ...x...
Страница 15: ...xvi Application Precautions 4...
Страница 41: ...26 Basic Operating Procedure Section 1 2...
Страница 243: ...228 Checking Configurations Section 5 7...
Страница 244: ...229 SECTION 6 Troubleshooting This section describes errors that can occur while using the CX Process Monitor Plus...
Страница 267: ...252 Reading Writing Function Block ITEMs Appendix A...
Страница 269: ...254 Differences between Trend Screens and Batch Trend Screens Appendix B...


