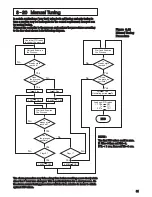
The PBu is called the
and the period of oscillation Tu is called
the
in the flow chart of Figure 3.23 . When this occurs, the
process is called in a
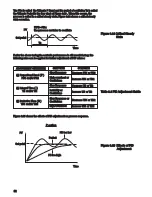
. Figure 3.24 shows a critical steady
state occasion.
Ultimate P Band
Ultimate Period
critical steady state
The PBu is called the
and the period of oscillation Tu is called
the
in the flow chart of Figure 3.23 . When this occurs, the
process is called in a
. Figure 3.24 shows a critical steady
state occasion.
Ultimate P Band
Ultimate Period
critical steady state
Set point
Set point
Tu
PV
Time
If PB=PBu
the process sustains to oscillate
If PB=PBu
the process sustains to oscillate
Figure 3.24 Critical Steady
State
Figure 3.24 Critical Steady
State
If after the above tuning,the control’s performance is still unsatisfactory, the
following rules can be applied for further adjustment of PID values :
If after the above tuning,the control’s performance is still unsatisfactory, the
following rules can be applied for further adjustment of PID values :
ADJUSTMENT SEQUENCE
ADJUSTMENT SEQUENCE
SYMPTOM
SOLUTION
(1) Proportional Band ( P )
PB1 and/or PB2
(1) Proportional Band ( P )
PB1 and/or PB2
(2) Integral Time ( I )
TI1 and/or TI2
(2) Integral Time ( I )
TI1 and/or TI2
(3) Derivative Time ( D )
TD1 and/or TD2
(3) Derivative Time ( D )
TD1 and/or TD2
Slow Response
Slow Response
High overshoot or
Oscillations
High overshoot or
Oscillations
Slow Response
Slow Response
Slow Response or
Oscillations
Slow Response or
Oscillations
Instability or
Oscillations
Instability or
Oscillations
High Overshoot
High Overshoot
Decrease PB1 or PB2
Decrease PB1 or PB2
Increase PB1 or PB2
Increase PB1 or PB2
Decrease TI1 or TI2
Decrease TI1 or TI2
Increase TI1 or TI2
Increase TI1 or TI2
Decrease TD1 or TD2
Decrease TD1 or TD2
Increase TD1 or TD2
Increase TD1 or TD2
Table 3.2 PID Adjustment Guide
Table 3.2 PID Adjustment Guide
Figure 3.25 shows the effects of PID adjustment on process response.
Figure 3.25 shows the effects of PID adjustment on process response.
Figure 3.25 Effects of PID
Adjustment
Figure 3.25 Effects of PID
Adjustment
PV
Time
P action
P action
Perfect
PB too high
PB too high
PB too low
PB too low
Set point
Set point
62

