


Using the ProCurve Web Browser Interface
Status Reporting Features
■
% Error Pkts Rx
: All error packets received by the port. (This indicator
is a reddish color on many systems.) Although errors received on a port
are not propagated to the rest of the network, a consistently high number
of errors on a specific port may indicate a problem on the device or
network segment connected to the indicated port.
■
Maximum Activity Indicator:
As the bars in the graph area change
height to reflect the level of network activity on the corresponding port,
they leave an outline to identify the maximum activity level that has been
observed on the port.
Utilization Guideline.
A network utilization of 40% is considered the
maximum that a typical Ethernet-type network can experience before encoun
tering performance difficulties. If you observe utilization that is consistently
higher than 40% on any port, click on the Port Counters button to get a detailed
set of counters for the port.
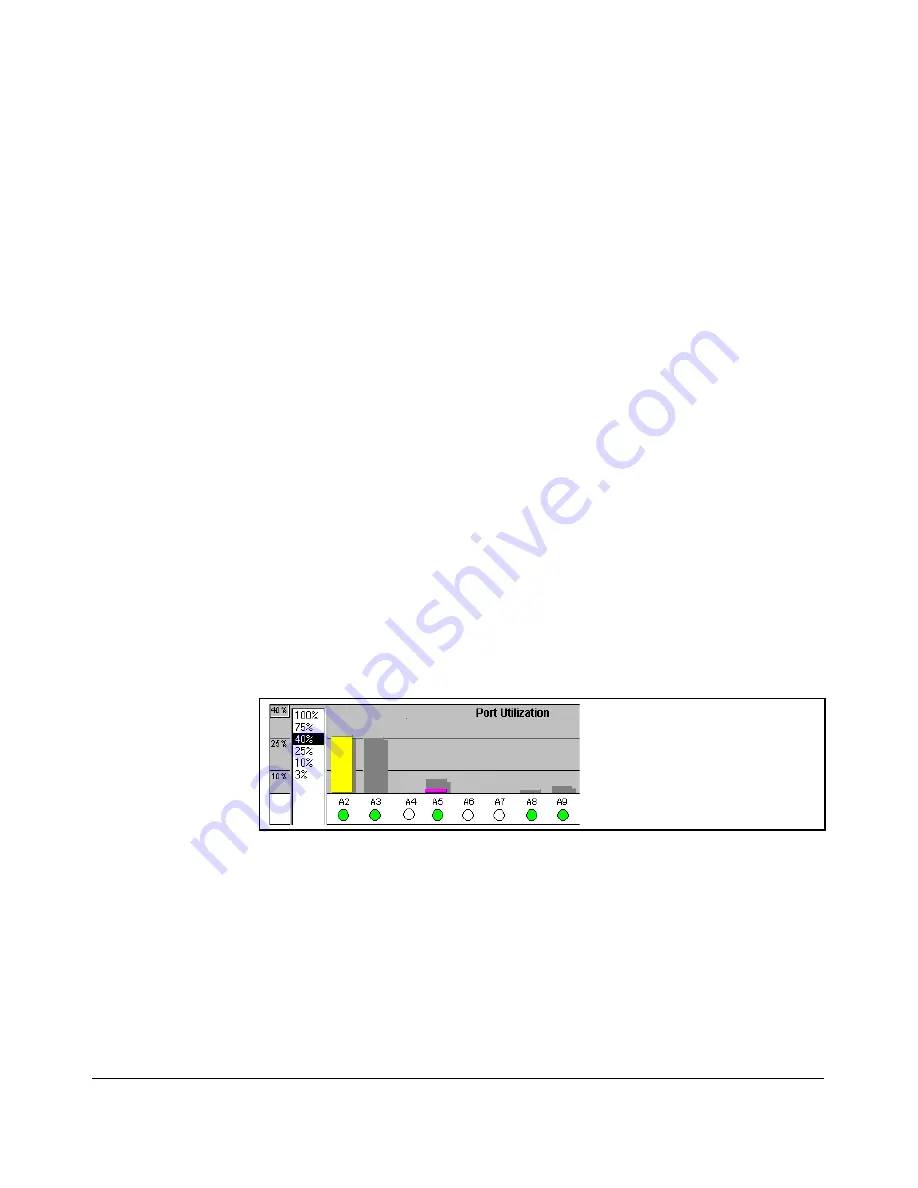
To change the amount of bandwidth the Port Utilization bar graph
shows.
Click on the bandwidth display control button in the upper left corner
of the graph. (The button shows the current scale setting, such as 40%.) In the
resulting menu, select the bandwidth scale you want the graph to show (3%,
10%, 25%, 40%, 75%, or 100%), as shown in figure figure 5-10.
Note that when viewing activity on a gigabit port, you may want to select a
lower value (such as 3% or 10%). This is because the bandwidth utilization of
current network applications on gigabit links is typically minimal, and may
not appear on the graph if the scale is set to show high bandwidth utilization.
Figure 5-10. Changing the Graph Area Scale
To display values for each graph bar.
Hold the mouse cursor over any of
the bars in the graph, and a pop-up display is activated showing the port
identification and numerical values for each of the sections of the bar, as
shown in figure 5-11 (next).
5-19
Содержание ProCurve 6120G/XG
Страница 1: ...ProCurve Series 6120 Switches Management and Configuration Guide November 2010 Version Z 14 22 ...
Страница 2: ......
Страница 3: ...HP ProCurve 6120G XG Switch 6120XG Switch November 2010 Z 14 22 Management and Configuration Guide ...
Страница 24: ...xxii ...
Страница 40: ...Getting Started To Set Up and Install the Switch in Your Network 1 10 ...
Страница 54: ...Selecting a Management Interface Advantages of Using ProCurve Manager or ProCurve Manager Plus 2 14 ...
Страница 70: ...Using the Menu Interface Where To Go From Here 3 16 ...
Страница 92: ...Using the ProCurve Web Browser Interface Contents Setting Fault Detection Policy 5 25 5 2 ...
Страница 160: ...Switch Memory and Configuration Automatic Configuration Update with DHCP Option 66 6 44 ...
Страница 288: ...Port Status and Configuration Uplink Failure Detection 10 42 ...
Страница 318: ...Port Trunking Outbound Traffic Distribution Across Trunked Links 11 30 ...
Страница 470: ...File Transfers Copying Diagnostic Data to a Remote Host USB Device PC or UNIX Workstation A 34 ...
Страница 487: ...Monitoring and Analyzing Switch Operation Status and Counters Data B 17 ...
Страница 518: ...Monitoring and Analyzing Switch Operation Traffic Mirroring B 48 ...
Страница 612: ...MAC Address Management Viewing the MAC Addresses of Connected Devices D 8 ...
Страница 616: ...Monitoring Resources When Insufficient Resources Are Available E 4 ...
Страница 620: ...Daylight Savings Time on ProCurve Switches F 4 ...
Страница 638: ...Network Out of Band Management OOBM Tasks G 18 ...
Страница 659: ...download to primary or secondary flash A 21 using to download switch software A 19 Index 19 ...
Страница 660: ...20 Index ...
Страница 661: ......