MCTB
155
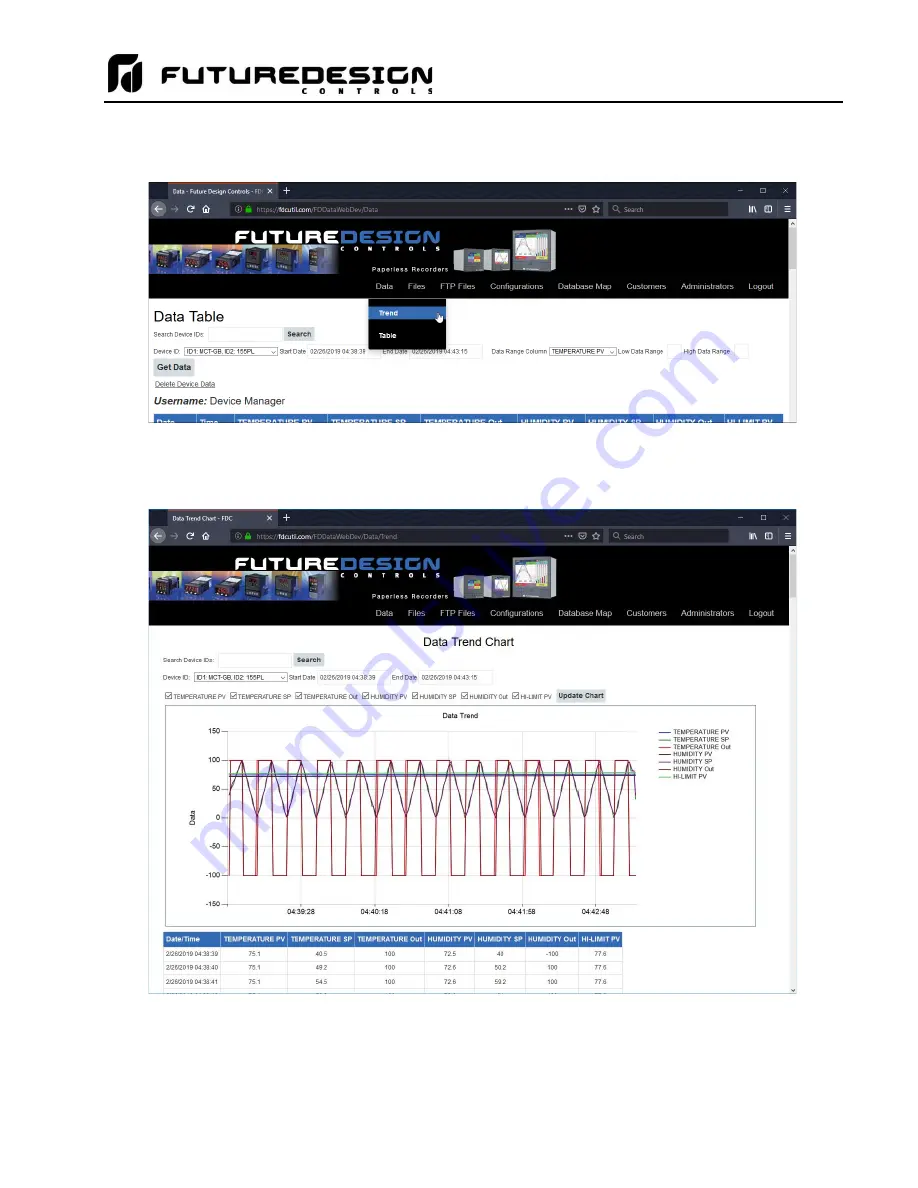
The available data can also be viewed in graph format. Hover the mouse over the Data tab and selections for
Trend and Table will be provided.
Once Trend is selected, choose the desired unit from the Device ID menu. Place a check next to each available
point you want to plot and click the Update Chart button. A trend plot according to the chosen plot points and
time range will be displayed along with the corresponding data table below.
NOTE:
Once you access the Data Table or Data Trend Chart page, the default start and end times are based
on the available data at the server. If an MCTB is actively sending data, you must manually set the
end time to a future date so that each time you refresh the page via the Get Data or Update Chart
buttons, the page is updated with the latest data sent from the MCTB.
Содержание MCTB 4.3
Страница 24: ...MCTB 24...
Страница 195: ...MCTB 195...
Страница 227: ...MCTB 227 A 5 SmartIO Monitor Module Specifications...
Страница 228: ...MCTB 228 A 6 Expansion IO Module Specifications...
Страница 229: ...MCTB 229 A 7 Power Supply Specifications DIN Rail Mount Power Supply Specifications...
Страница 230: ...MCTB 230...
Страница 231: ...MCTB 231 Open Frame Power Supply Specifications...
Страница 232: ...MCTB 232...
Страница 233: ...MCTB 233 A 8 Power On Delay Relay Specifications GE1A C10HA110...
Страница 234: ...MCTB 234...


